(Version 0.9.15) Tutorial related to an experience attempting to tune and understand metrics related to a Graphite instance on an Ubuntu 16.04 virtual machine. These details are related to attempting to drive conclusions about a single graphite/carbon setup in AWS, and assume that the Graphite stack is already up and running.
Background
Running a highly-available and scalable Graphite stack does not come without its problems. Graphite provides an architecture such that you can have a single relay in front of many Carbon cache instances, and using consistent hashing, ensure that only one Carbon cache instance would ever handle a single metric. However, if one of the Carbon cache instances goes down, reliance on the Relay to keep a cache of data long enough to recover could be problematic in a very high throughput metrics stack. In addition, the concept of “rebalancing” the cache instances is also not very painless.
In an initial setup, the question for this post is whether a single instance would be “good enough” for the data throughput both today, and potentially in the near/medium-term future. That is not to say that the architecture should not support scalability down the road (such as sharding for specific metrics to help with load), but in the interest of simplicity, this post will focus solely on a single Graphite setup.
Initial Setup - Architecture
A couple different benchmarks were attempted on different AWS instance types. At the end of the day, it appears as though a t2.large instance was, ironically enough, the “winner” between the two instances. Choosing an m3.xlarge instance (which had 15GB RAM and 4x vCPUs at 2.5GHz at the time of this post) and running the test failed so quickly with the same tuning parameters that it is not worth mentioning in this post. Further and deeper investigation is likely in order, but will not be included in this post.
As stated, the t2.large proved to be the more performant of the two instance types tested. At the time of this post, a t2.large instance has 8GB RAM and 2x vCPU at 3.0-3.3GHz with burst capabilities. Both instance type tests were run with a separately-attached GP2 storage volume of 100GB in size. At the time of this post, a GP2 instance affords a solid-state drive with 300 IOPS, burstable up to 3000 IOPS.
Re-iterating - the graphs and explanations below correspond to the following test setup:
- Single graphite instance deployment (Carbon Cache, Whisper and Graphite-Web all on the t2.large instance).
- Graphite-Web deployed as part of an Apache setup.
- All software installed on a single t2.large instance (2x vCPU @ 3.0-3.3GHz/burstable, 8GB RAM, 100GB SSD w/300 IOPS - burstable to 3000 IOPS). ** Whisper 0.9.15 ** Carbon Cache 0.9.15 ** Graphite-Web 0.9.15, configured with Apache and Memcached
- 24 hours of metrics stored in an AWS Kinesis stream.
- NodeJS script on a separate t2.small instance which pulls data from Kinesis starting at HORIZON (24 hours prior) up to current time at the maximum rate allowable by Kinesis (approx. 500 reads/second) and sends them to the Carbon Cache instance. ** Note that the NodeJS script actually used the TCP connector to the Carbon cache instance for reasons of wanting to ensure no data loss.
- Grafana for visualization.
Minimal Tuning
The out of box values for the Graphite setup were used in most cases. However, a couple metrics were updated for tuning the application. Specifically, the following interesting parameters were used in these tests:
MAX_CACHE_SIZE = inf
MAX_UPDATES_PER_SECOND = 800
MAX_CREATES_PER_MINUTE = 50
Graphs - Overview
Note: each graph below contains two “Trials” - one for each of the t2.large tests that were performed.
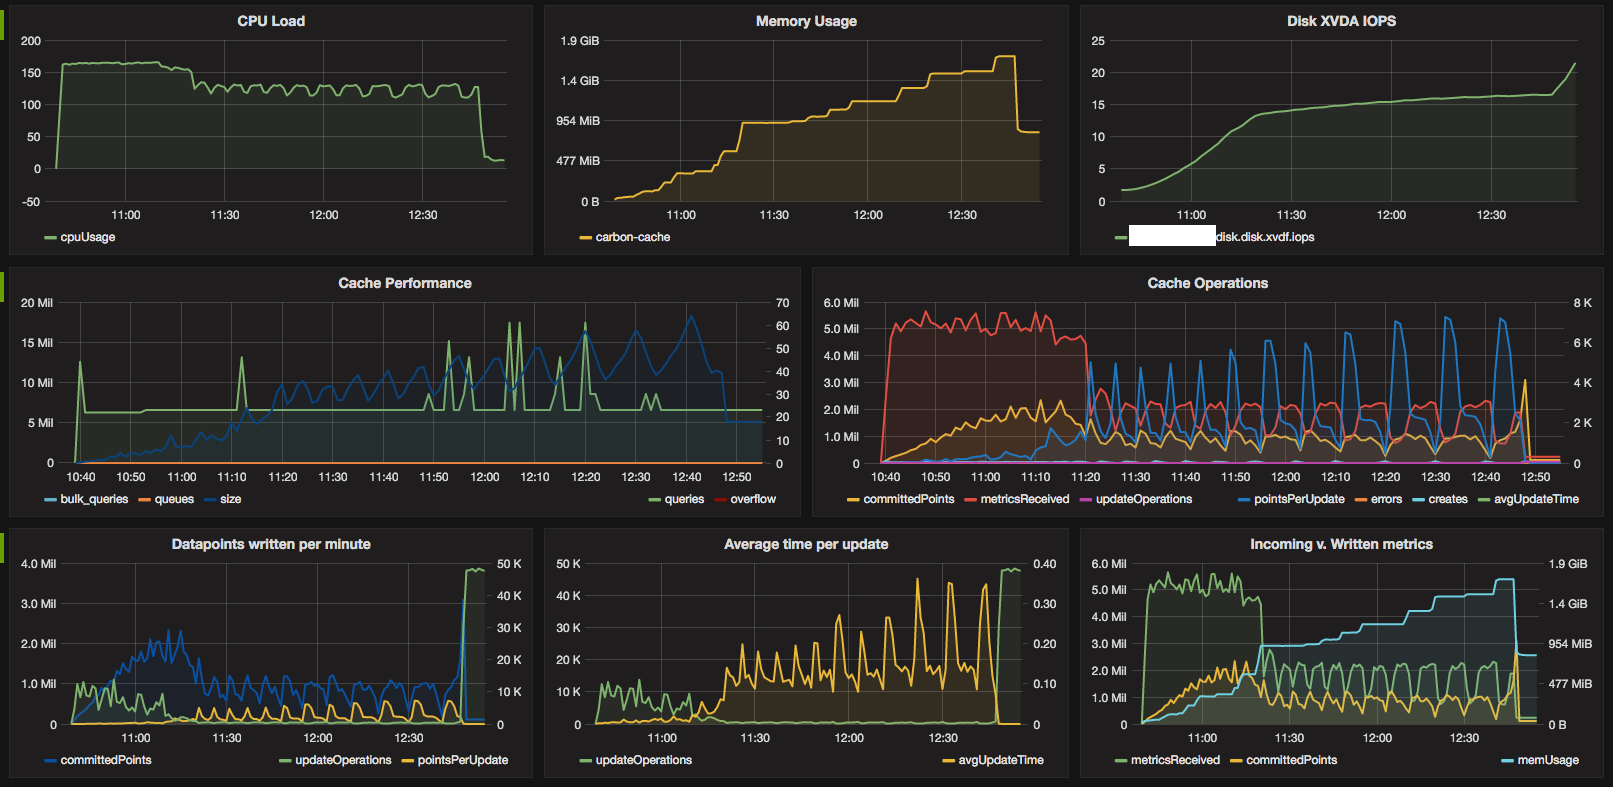
The Grafana overall dashboard was set up like below. Some of the graphs were redundant, but helped paint the picture of what was going on with the stack:
Trial 1
 Trial 2
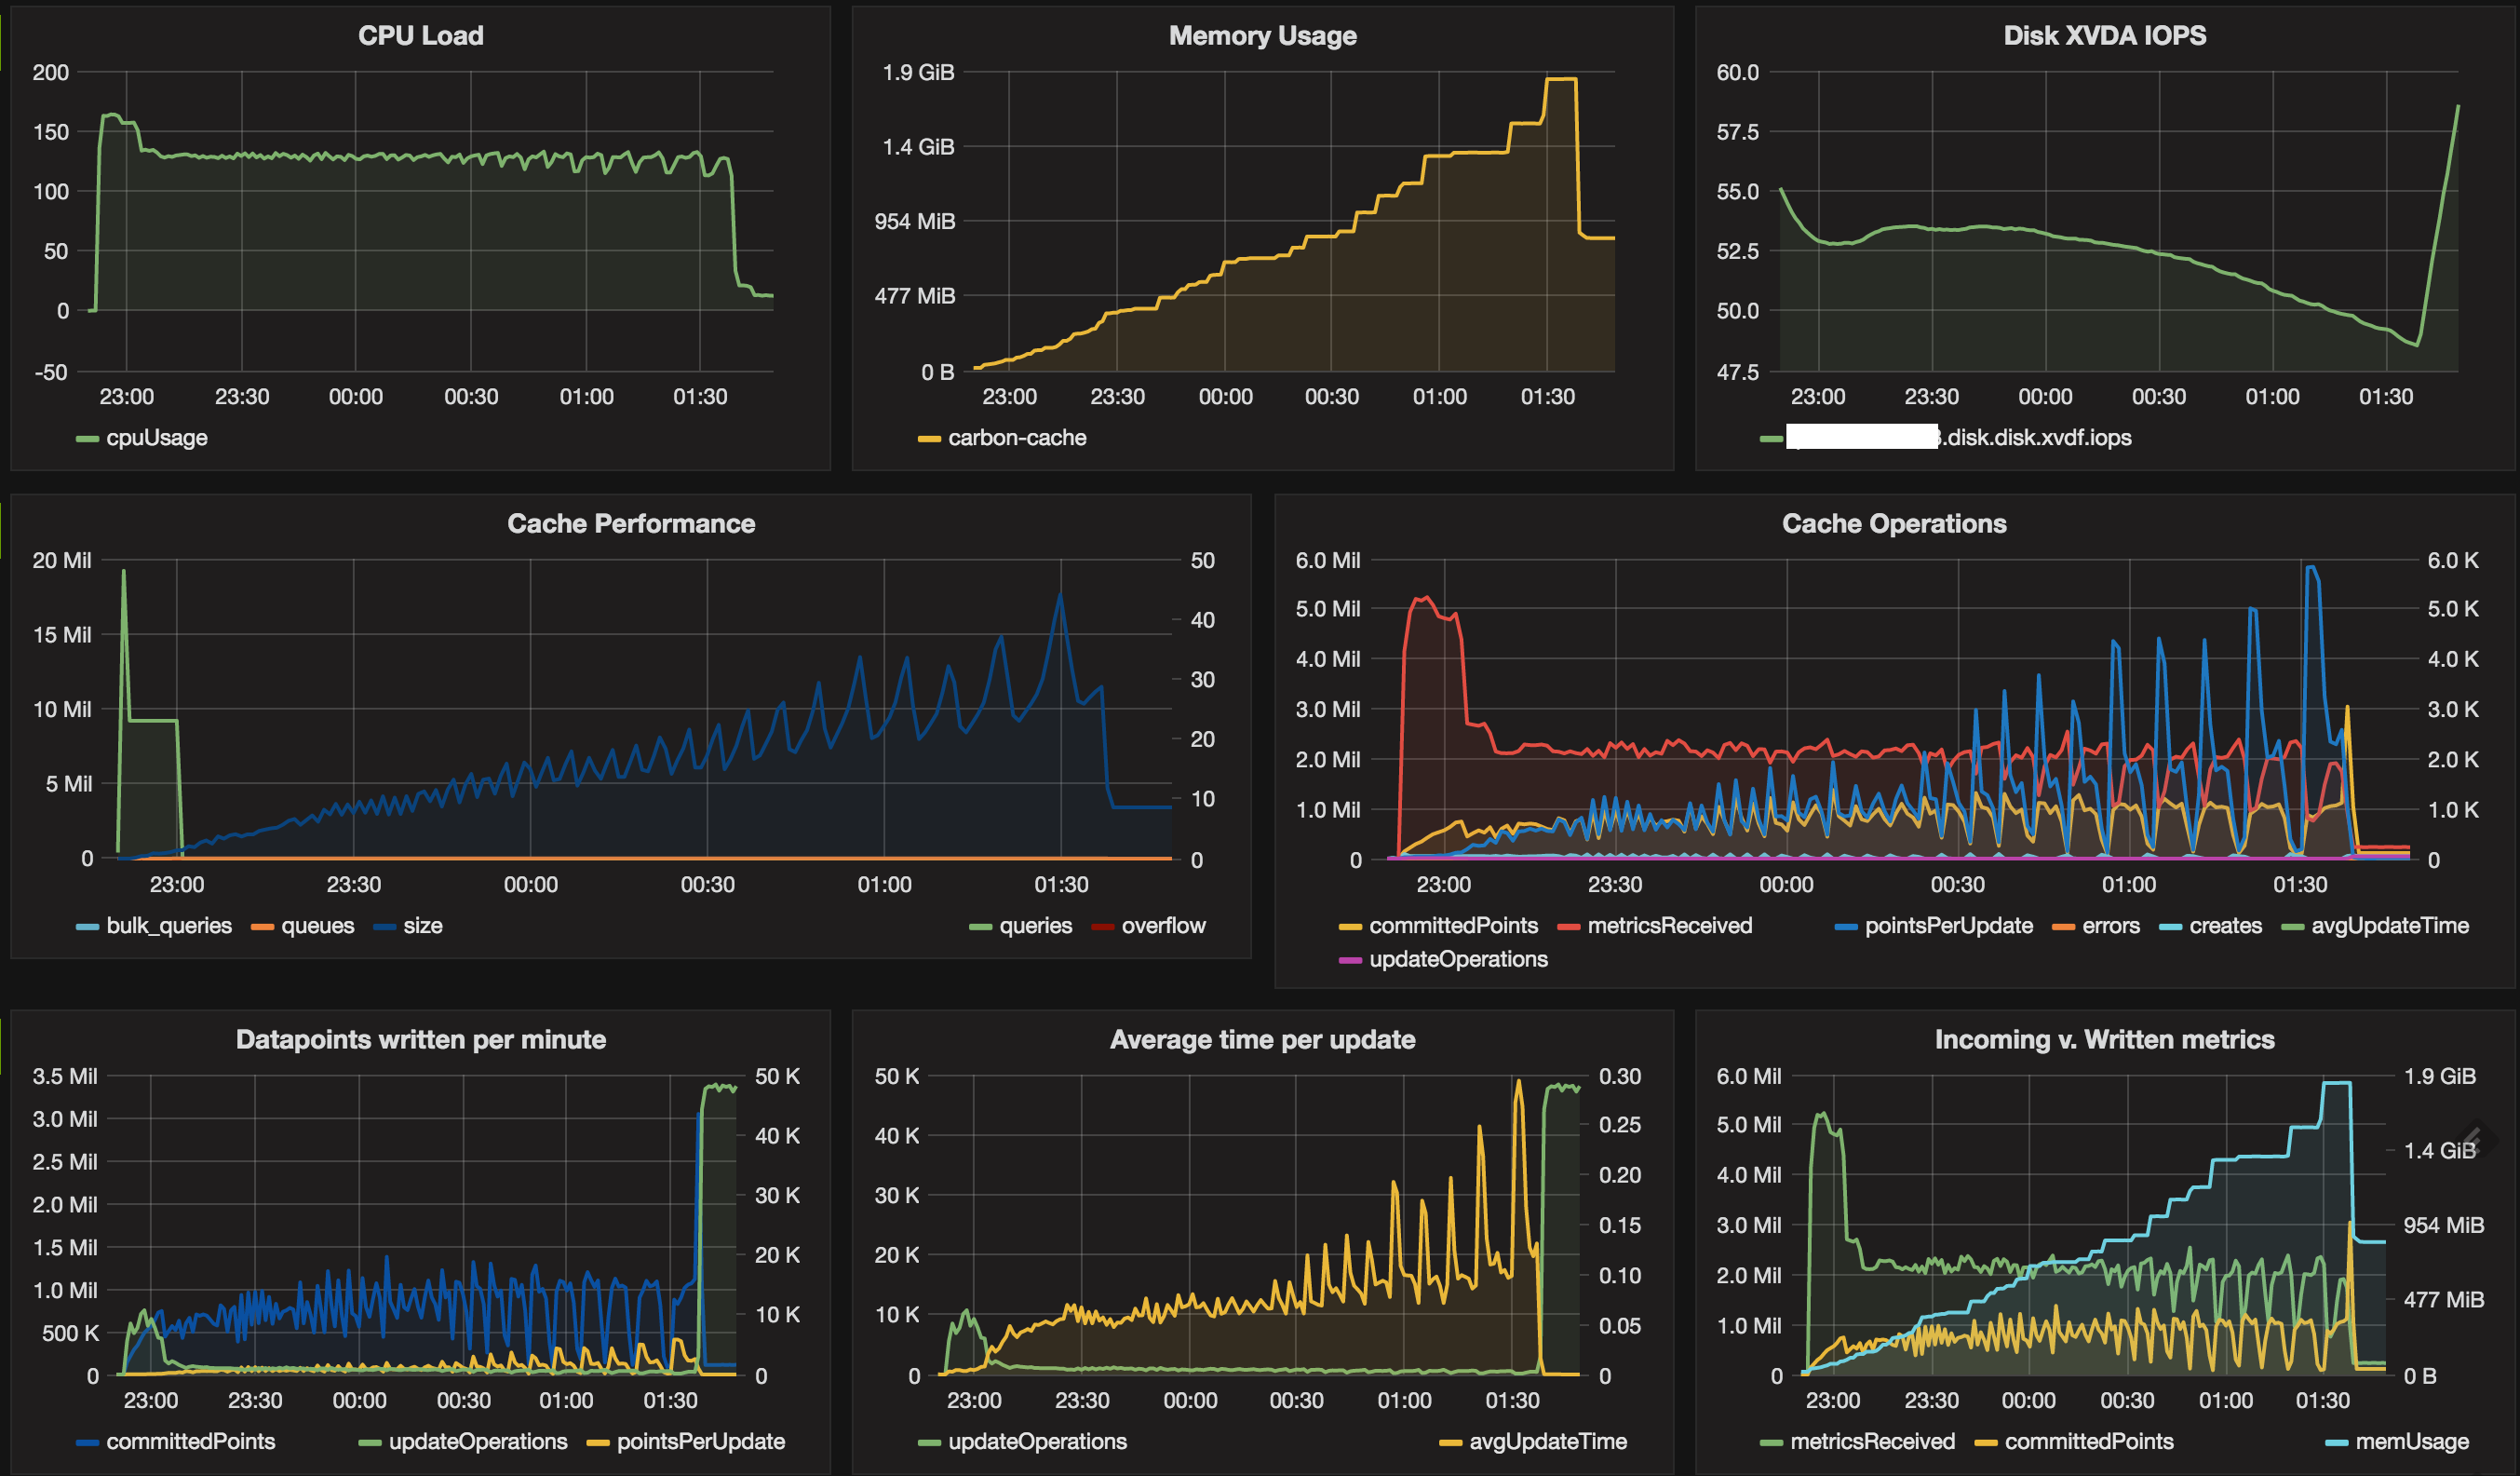
In summary, the t2.large instance did fairly well. It took just about 2 hours to fully ingest all metrics at a starting rate of about 5 million metrics per minute (CPU burst helped), and tapered down closer to 2 million per minute once the burst credits ran out on the instance. The front-loading of 24-hours of data at a rate of 5 million per minute was no issue. However, upon further examination of the graphs, it is clear that this rate would not be able to be sustained (and the memory consumption would likely take down the instance over time).
Drilling into each graph in the dashboard a bit…
Trial 1
 Trial 2
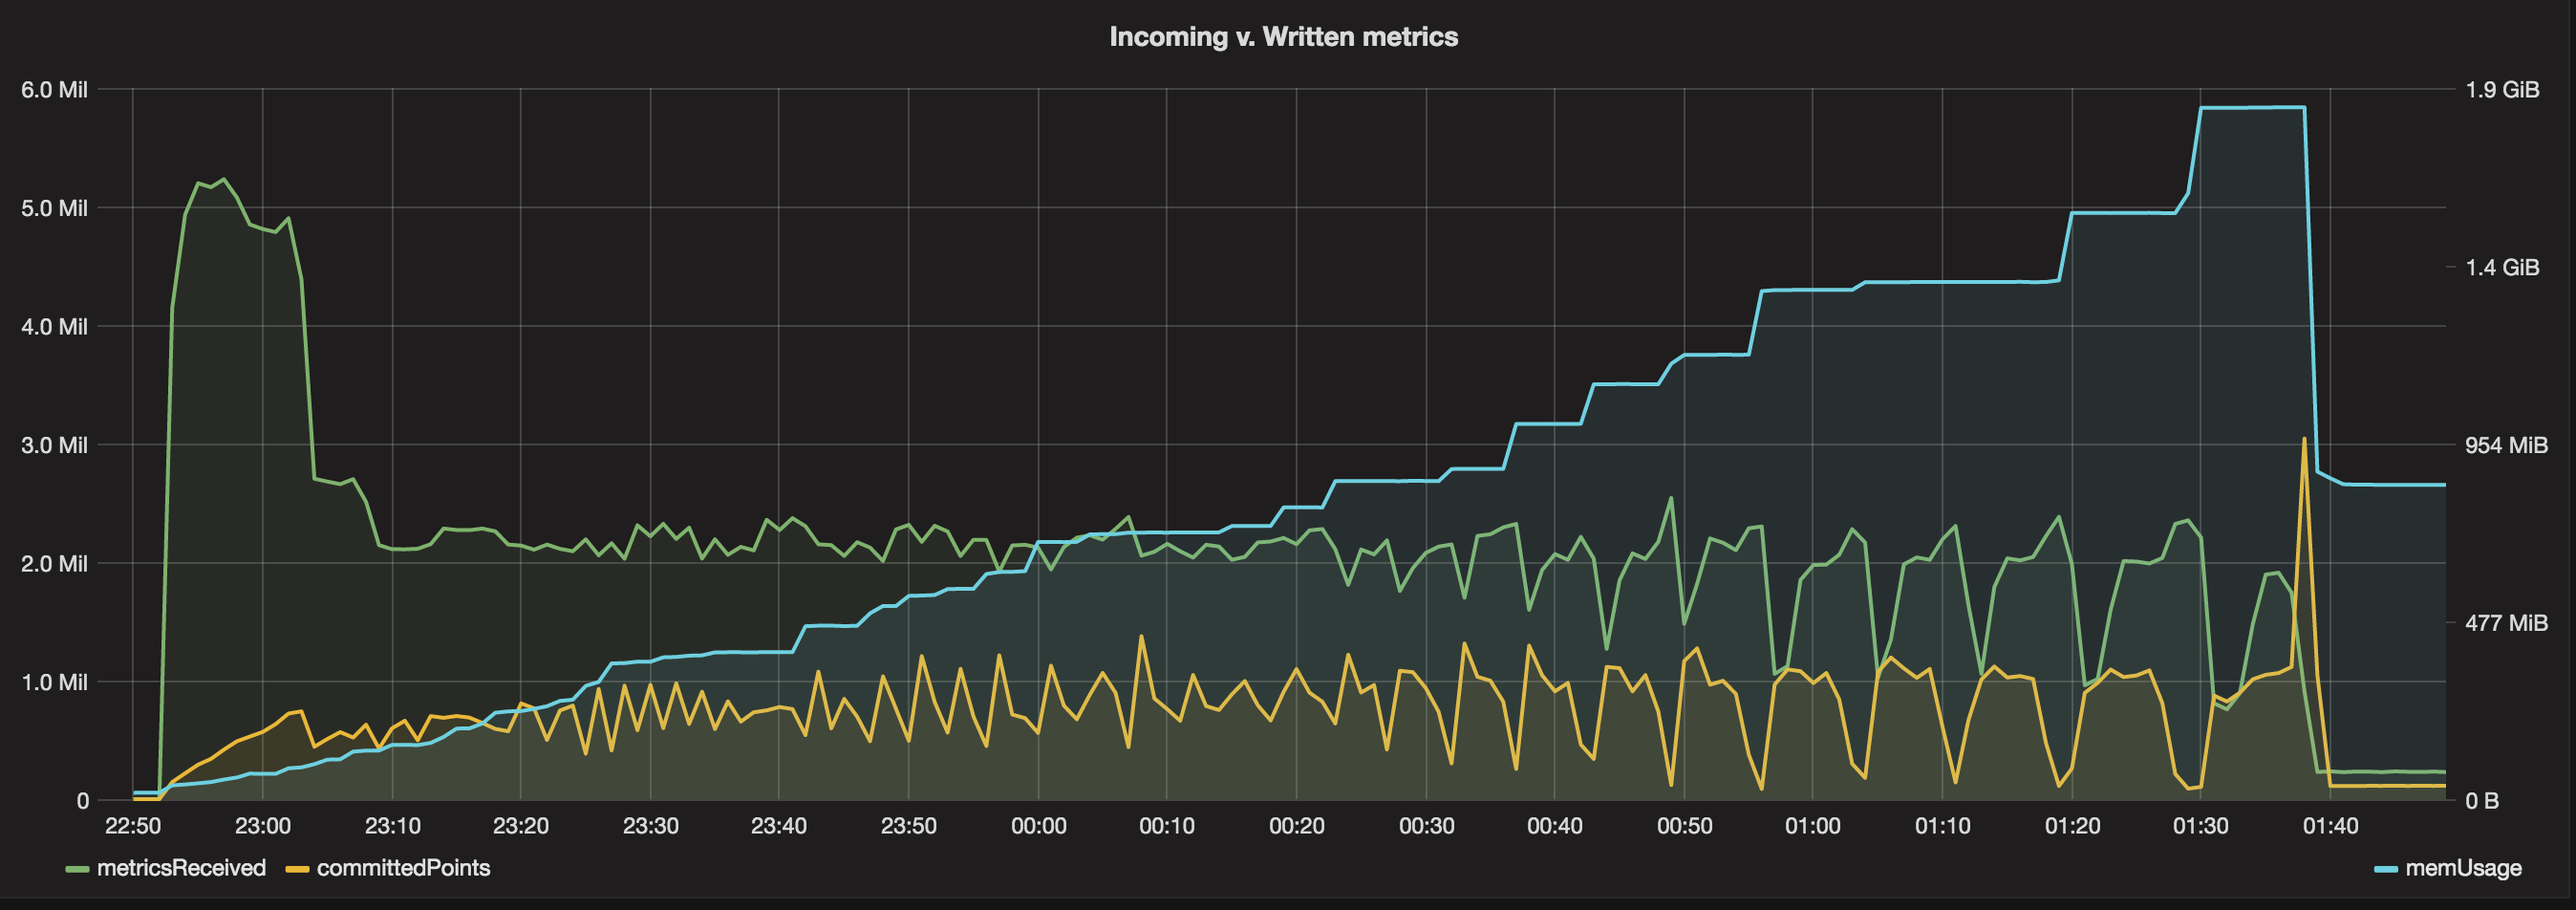
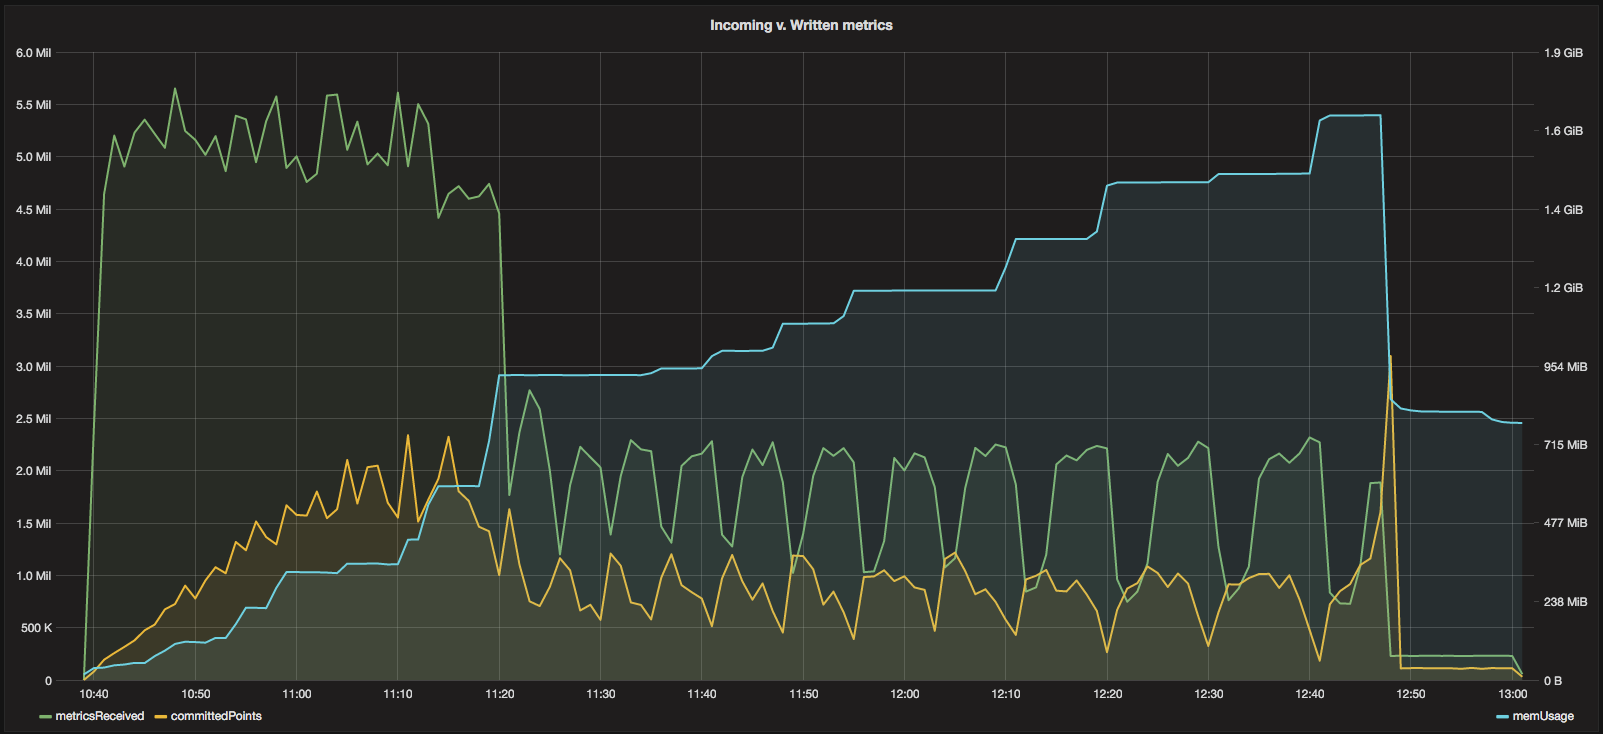
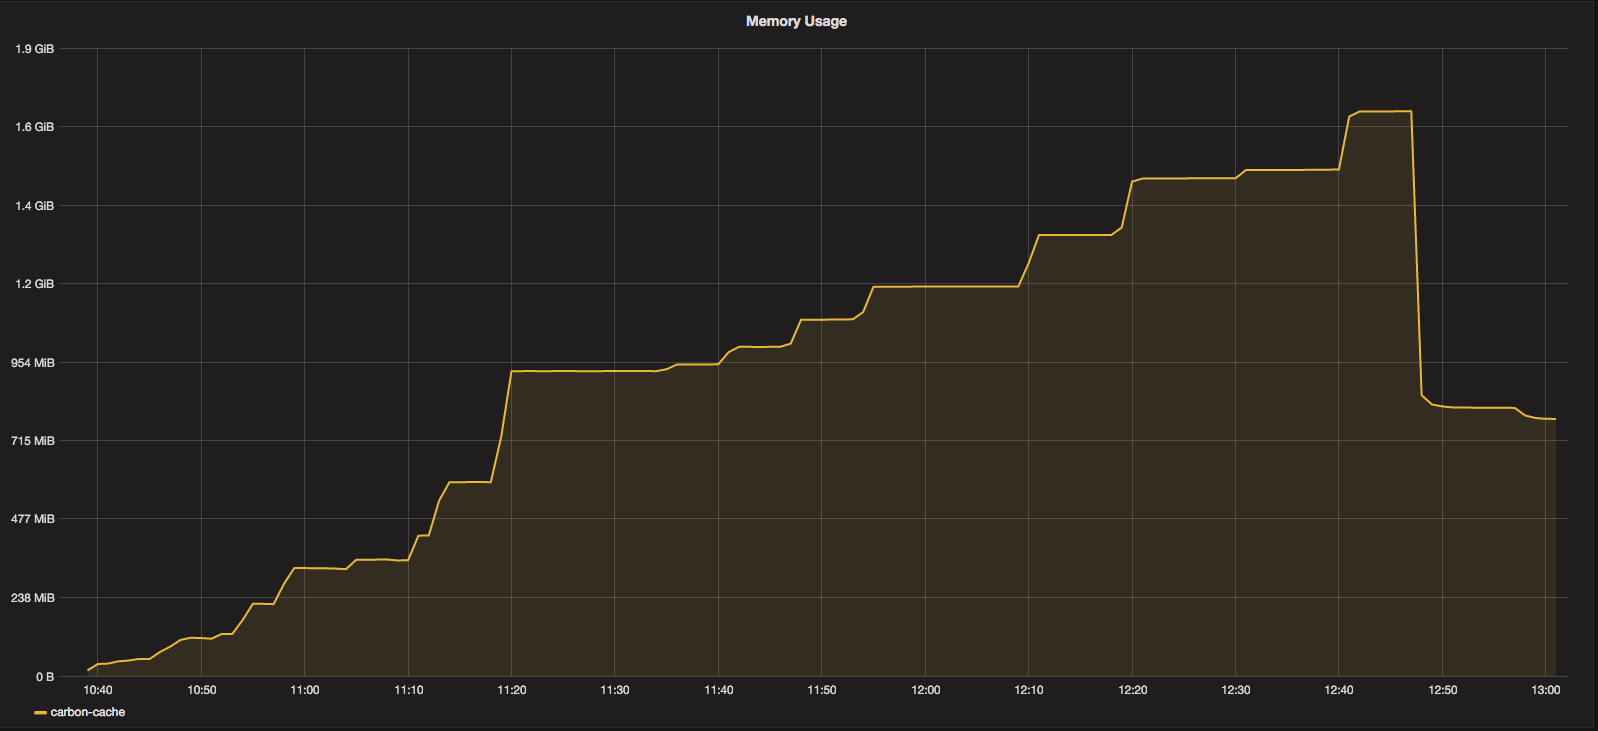
The graph above, related to the received metrics vs. committed metrics (with the memory overlay), demonstrates
some raw performance metrics related to the Graphite setup. The very first block of time (from 10:40 to
around 11:20) shows that the metricsReceived were around 5 million per minute due to the burstable CPU credits
being consumed. committedPoints during this timeframe lagged quite significantly, but improved over time.
Following the 11:20 timeframe, the metricsReceived was throttled, theoretically based on lack of processing power
(given the NodeJS script was using TCP to send metrics, I presume that the Graphite instance slowing down
processing caused a synchronous block/slow down of the NodeJS acknowledgements, which throttled the overall
throughput between the script and the Carbon cache). However, during this timeframe, the metricsReceived still
floated between 1-2.25 million metrics/minute with a much more consistent/close committedPoints metric, which was
very positive.
Trial 1
 Trial 2
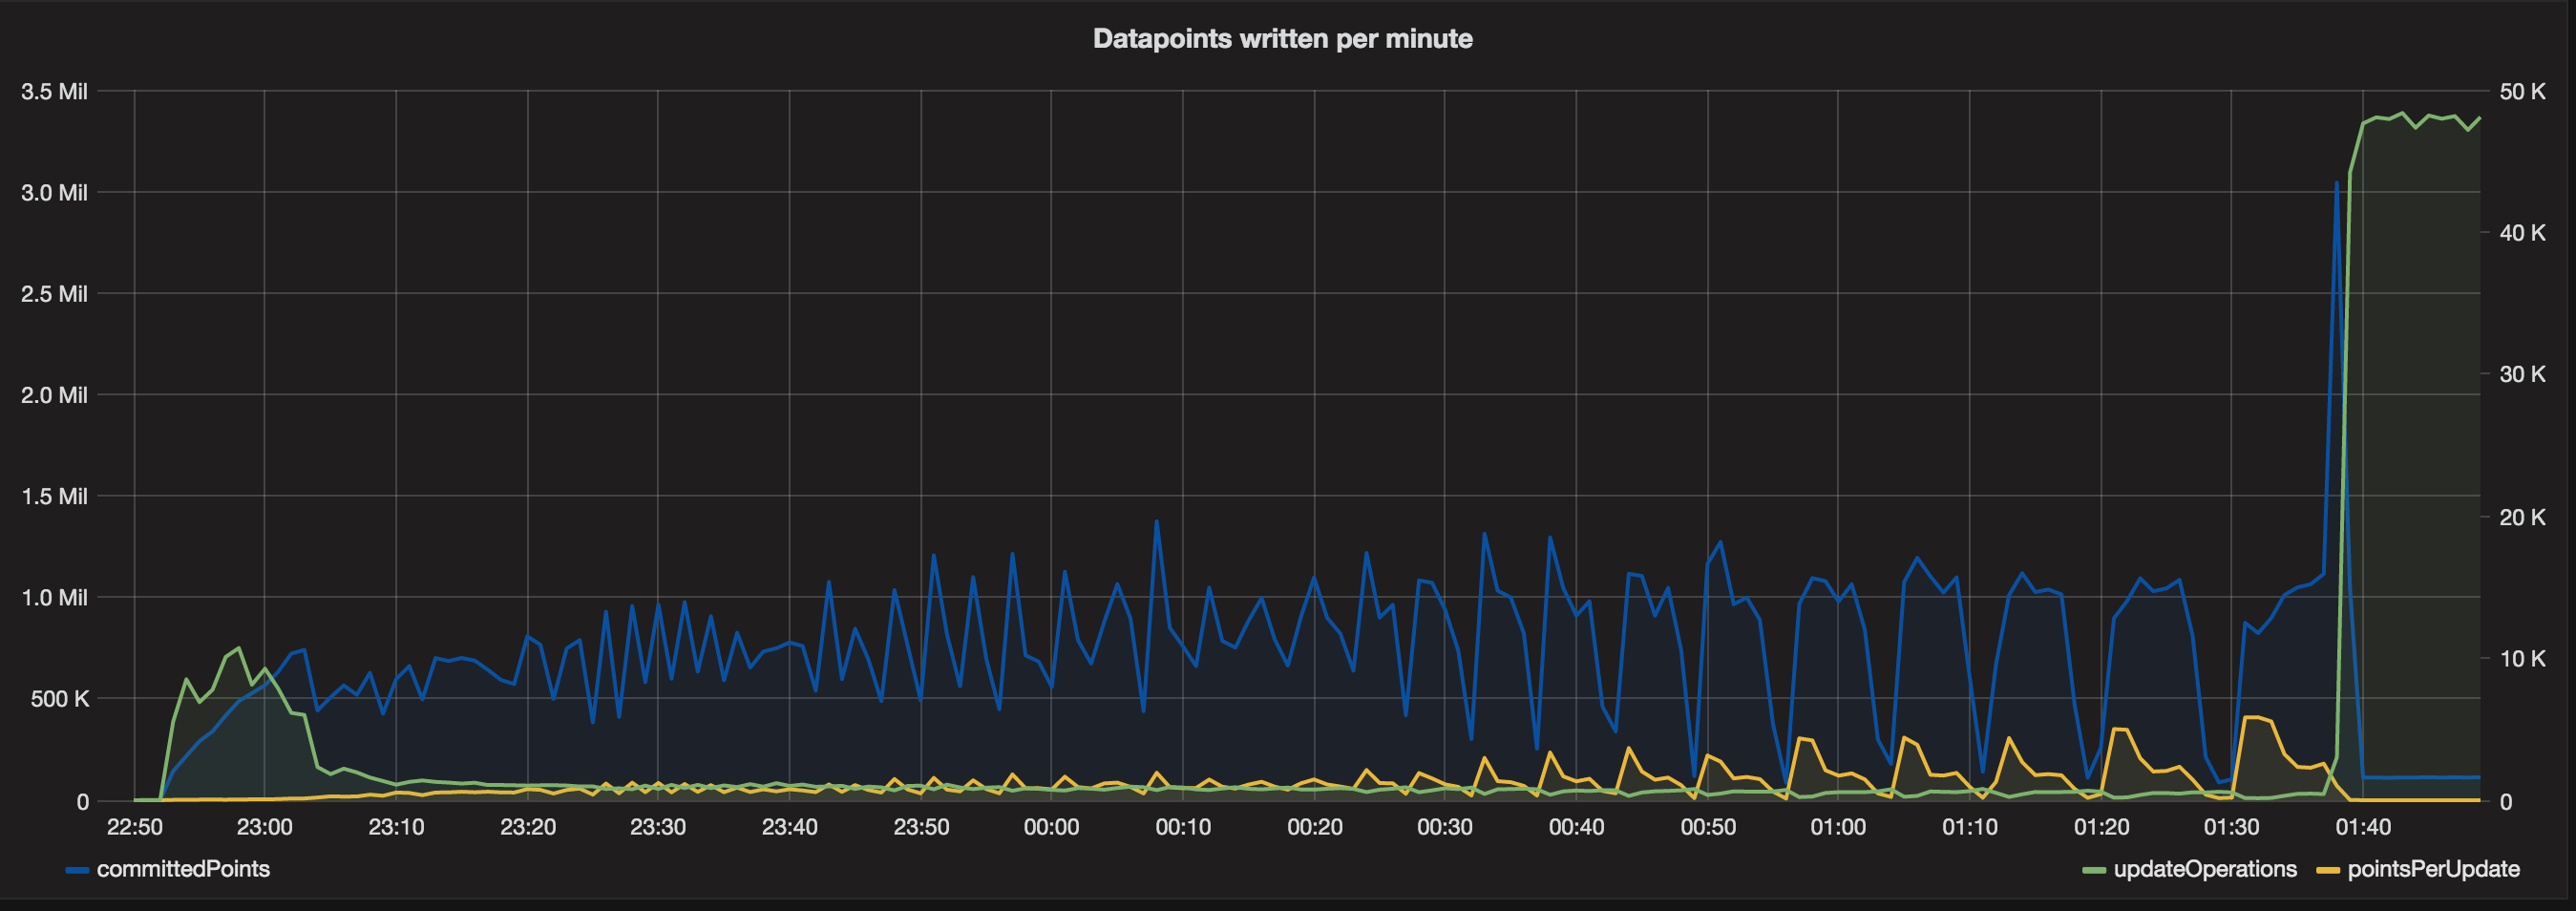
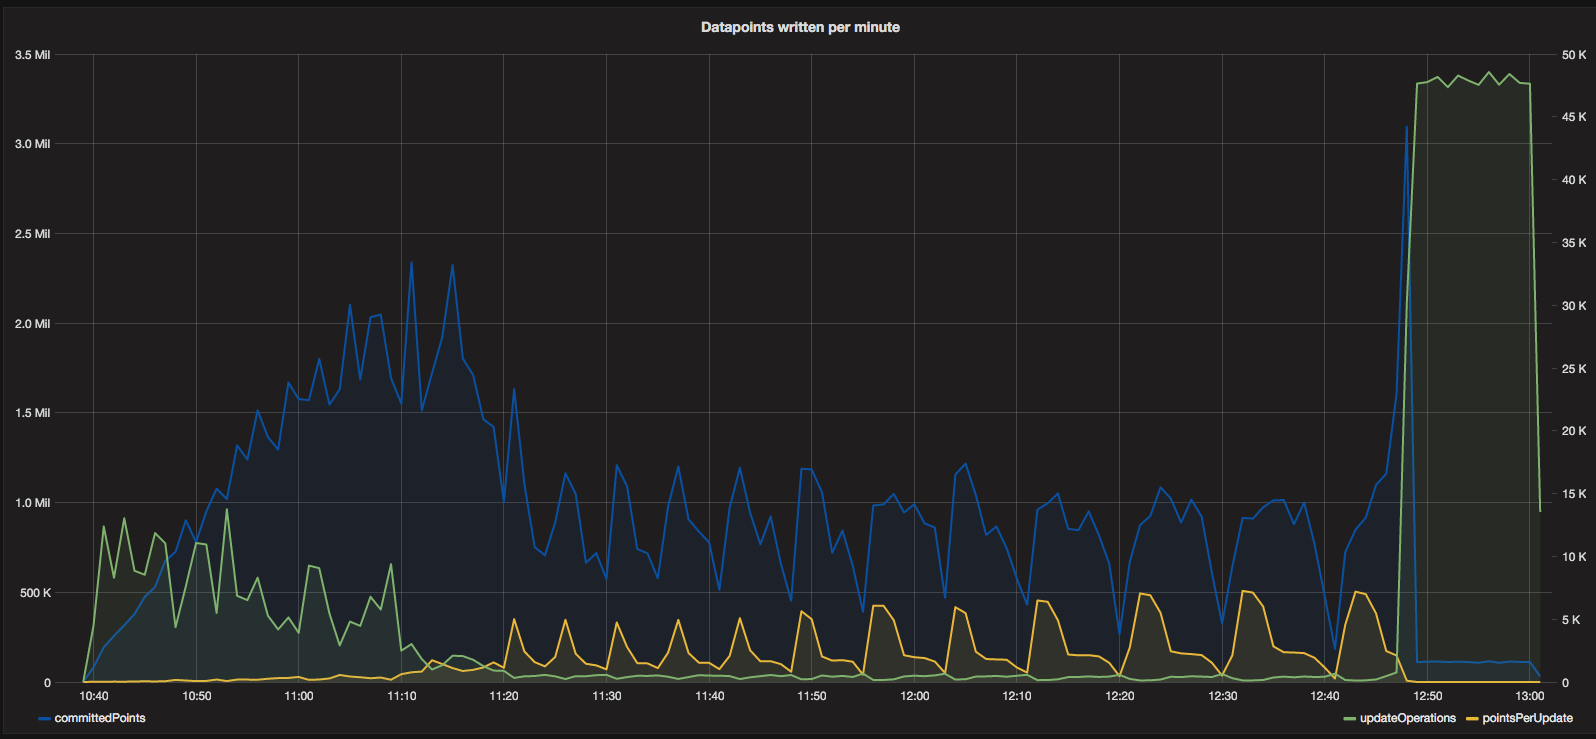
In the “Datapoints written per minute” graph above, the scale makes it a bit difficult to see - however, zooming
into the real data shows that the result is fairly what we expect, which is that the committedPoints metric is
roughly the product of the updateOperations times pointsPerUpdate metrics. Again, the front portion of the
graph represents the larger incoming metricsReceived from the prior graph of around 5 million metrics/minute.
Trial 1
 Trial 2
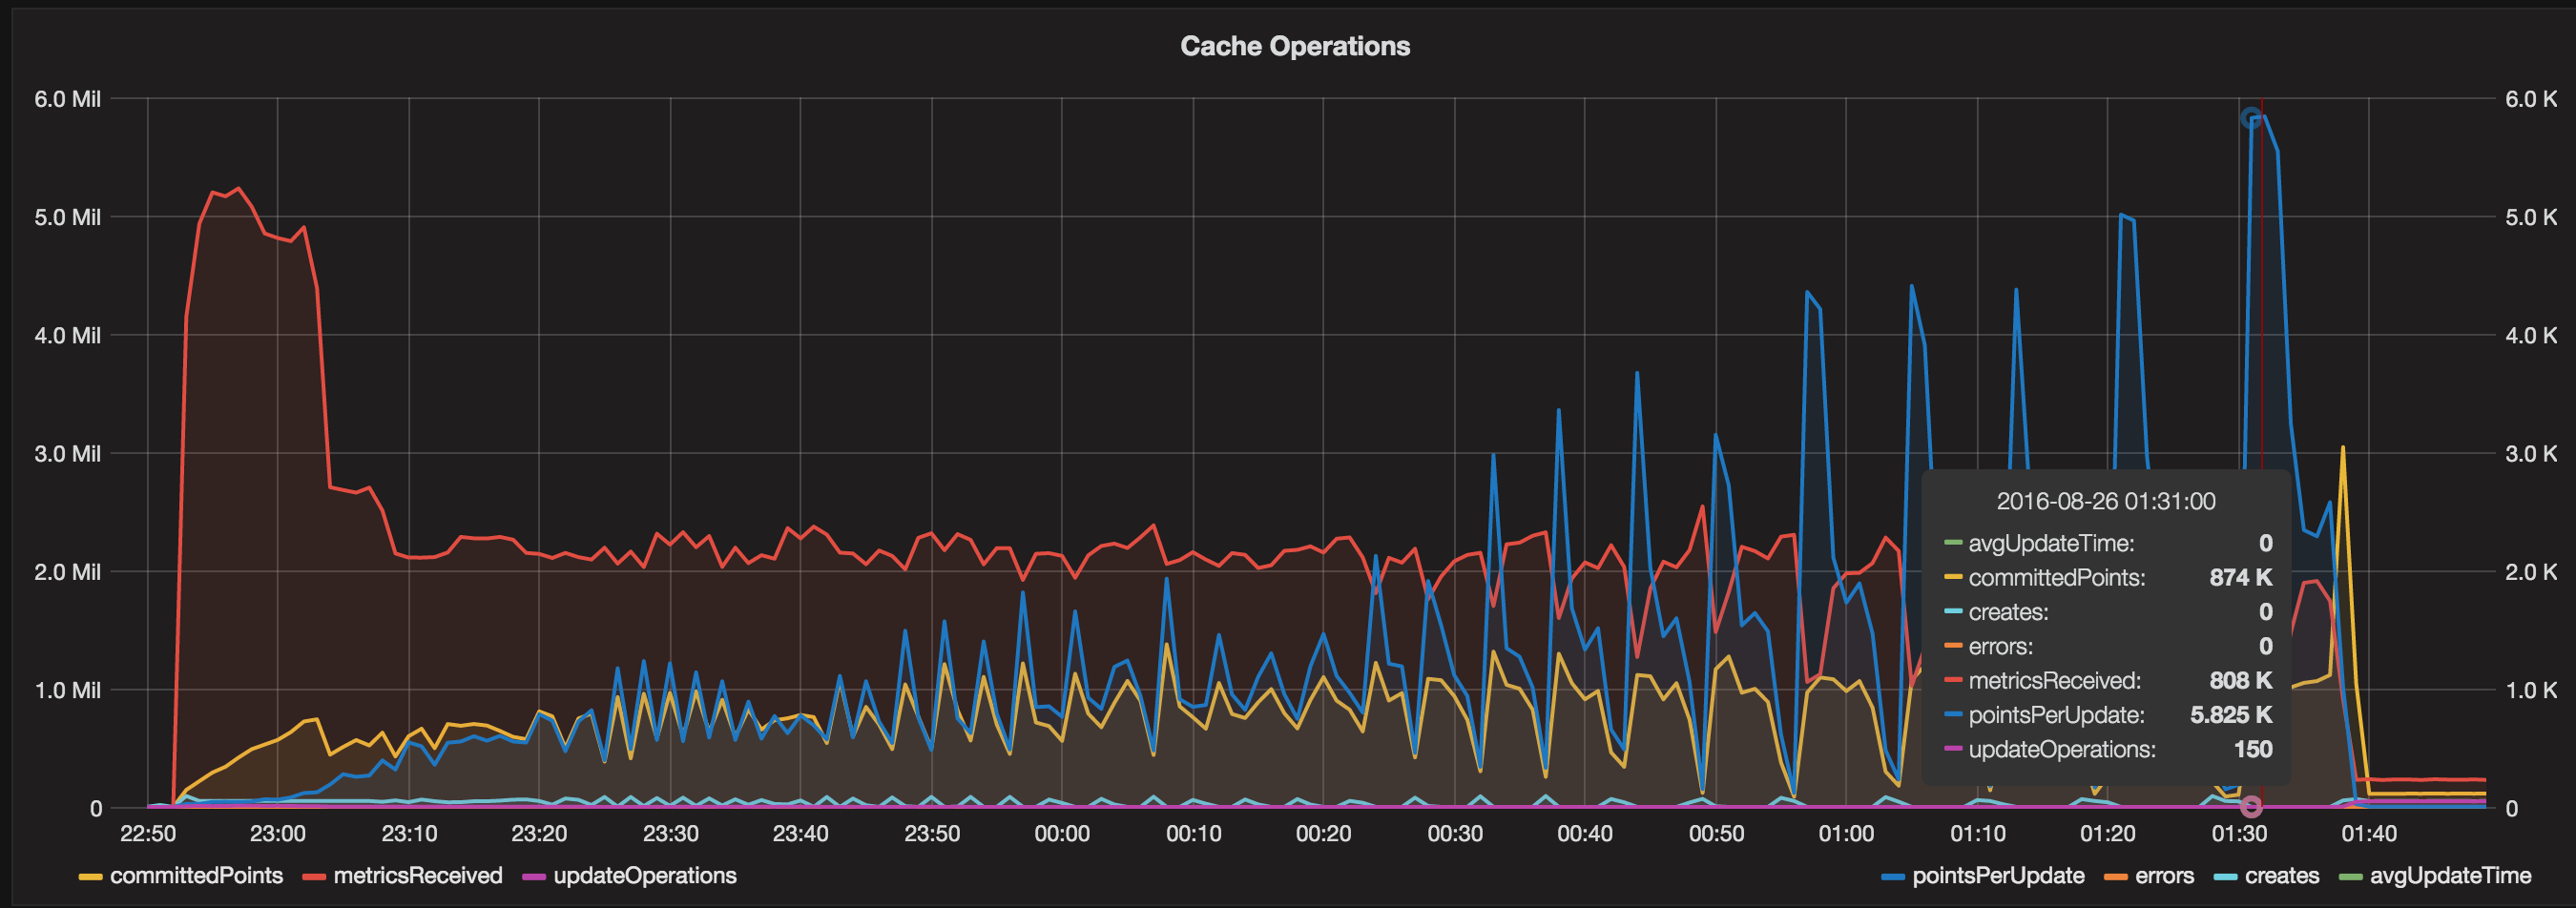
The next interesting graph is the above, which shows most of the metrics related to the Carbon cache in one single
view. Up front, the instance is working extremely hard, and the metrics data points are rather smoothed. However,
as the processor dips and the metricsReceived decrease to around 2 million metrics/minute, the metrics associated
with the Carbon cache instance exhibit more of a saw-tooth characteristic, which is more in line with what we would
expect for a stable Graphite setup that is generally keeping up with the metricsReceived.
Trial 1
 Trial 2
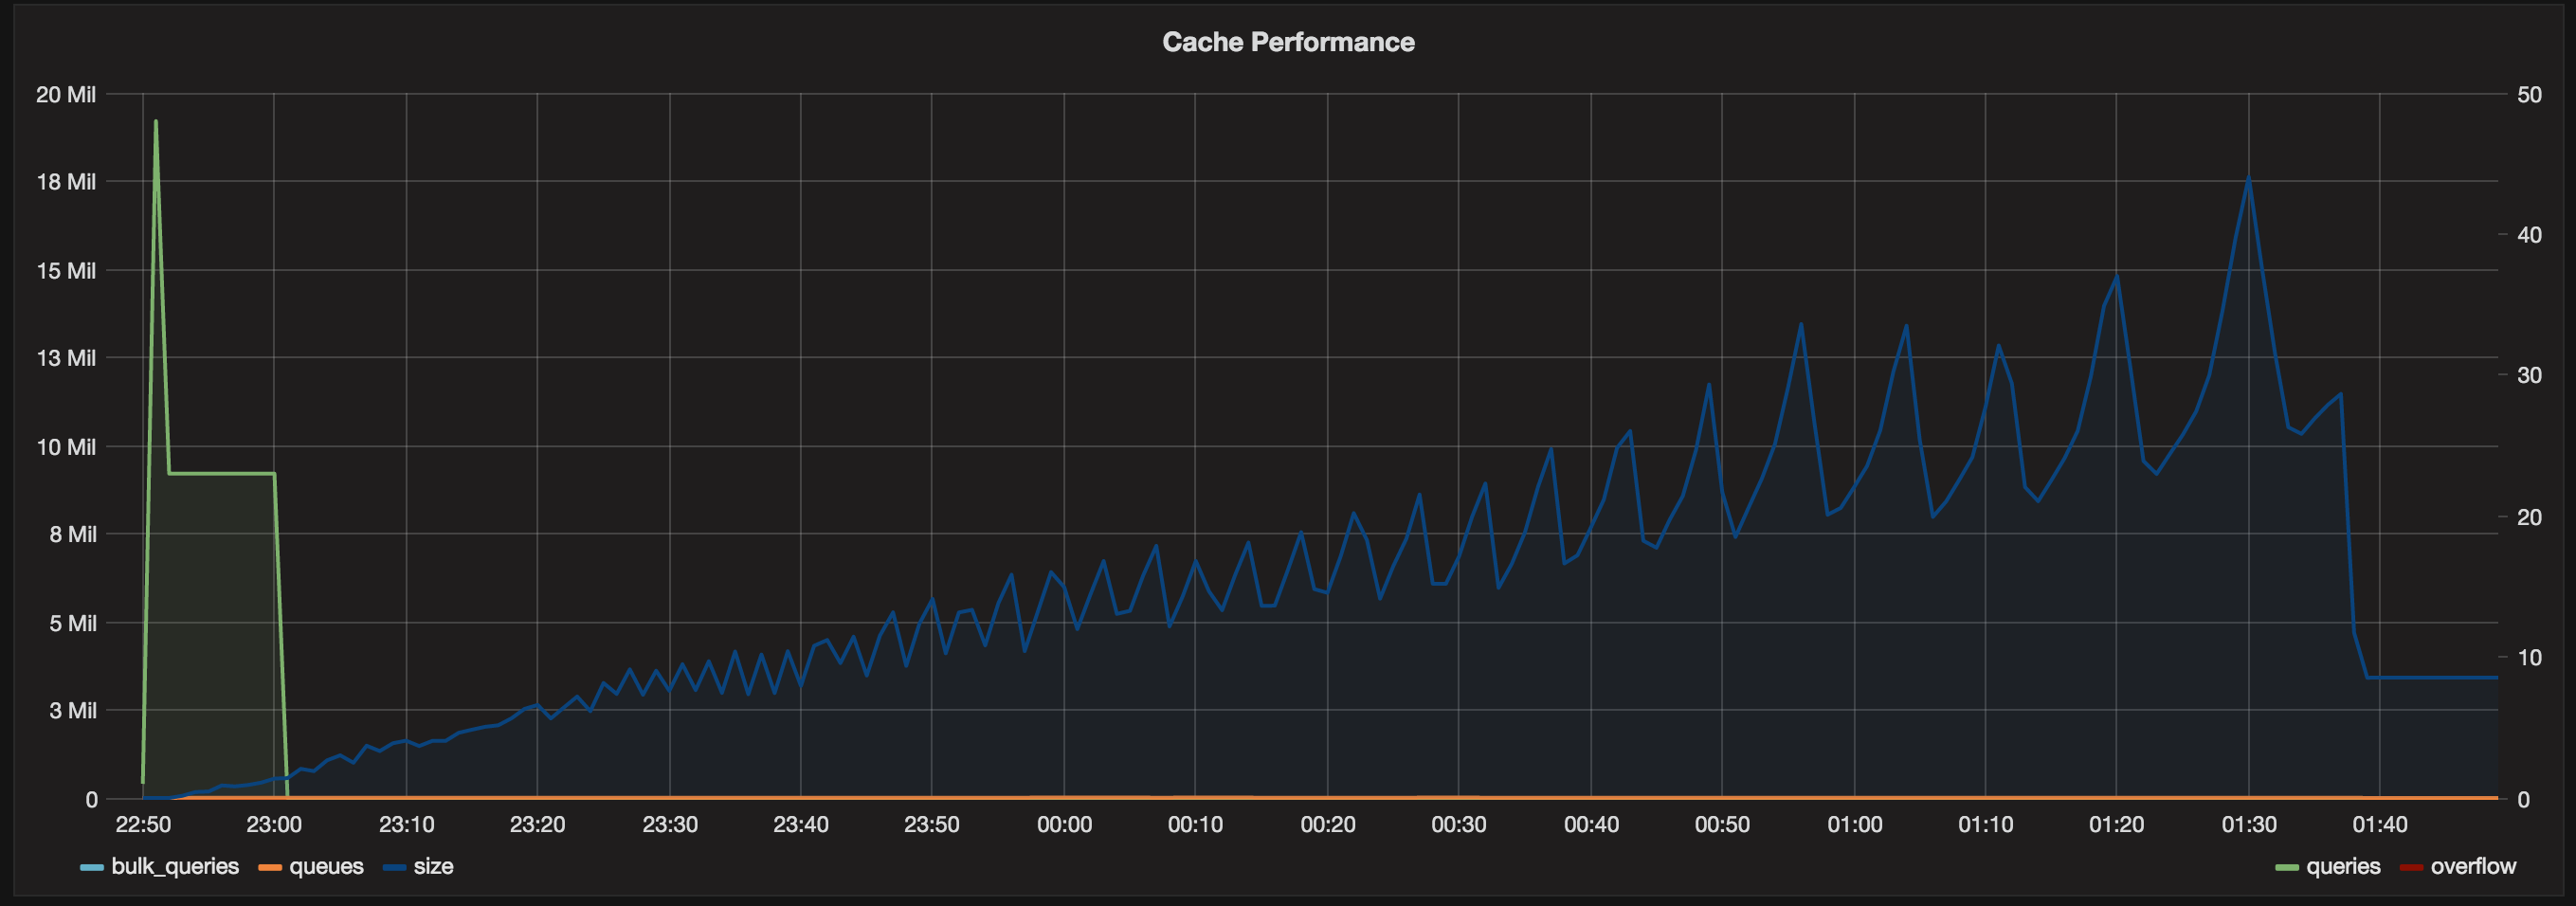
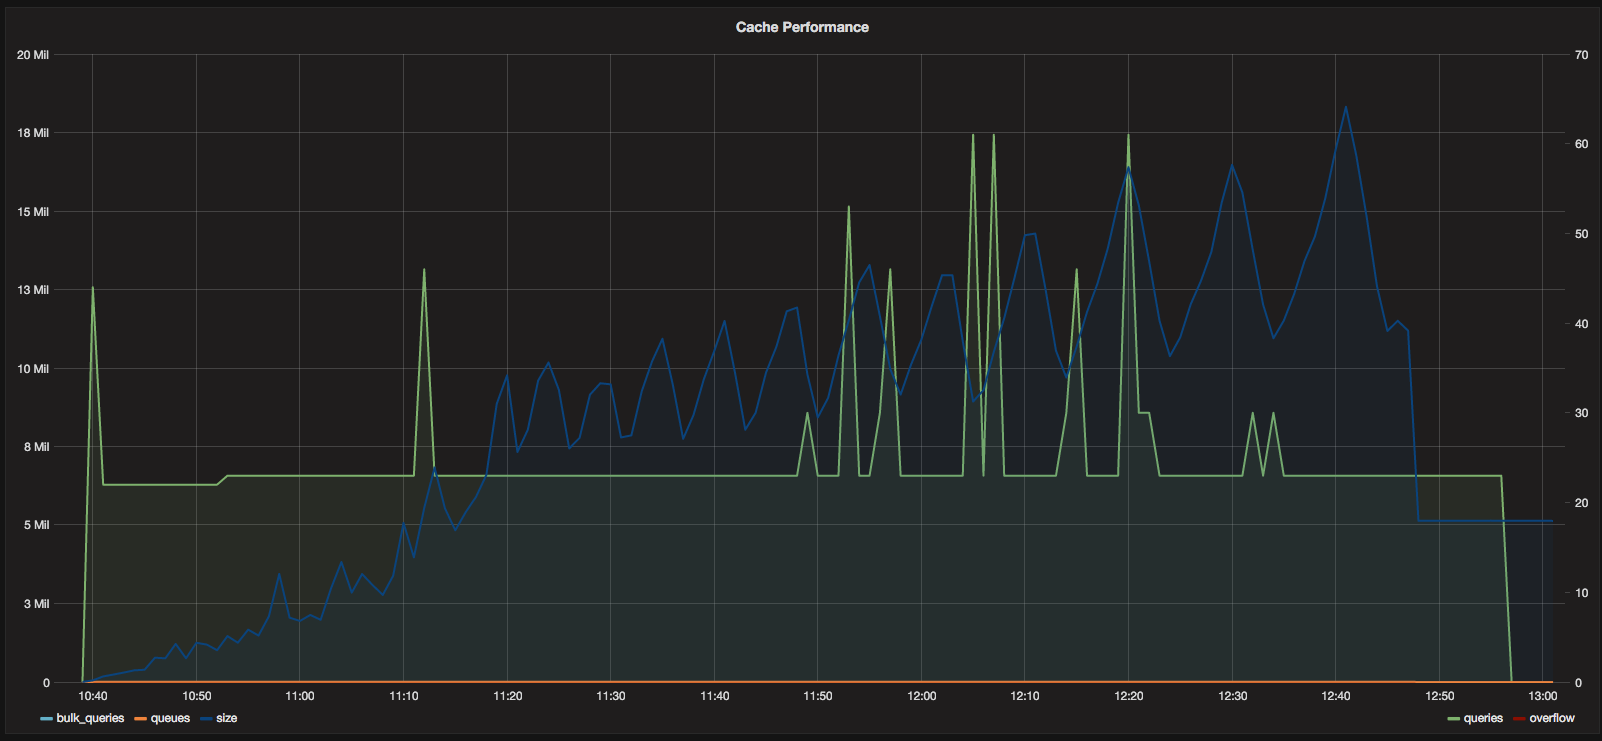
It is fairly difficult to see in the above graph (I should have used different colors) but the interesting metric in this graph is the cache size. At the maximum, the cache size grew to about 19 million data points, which is decently impressive. The queries on this graph are consistent with the combination of memcached and the Grafana dashboard, and the other metrics are not visible due to the graph scale.
Trial 1
 Trial 2
Trial 1
 Trial 2
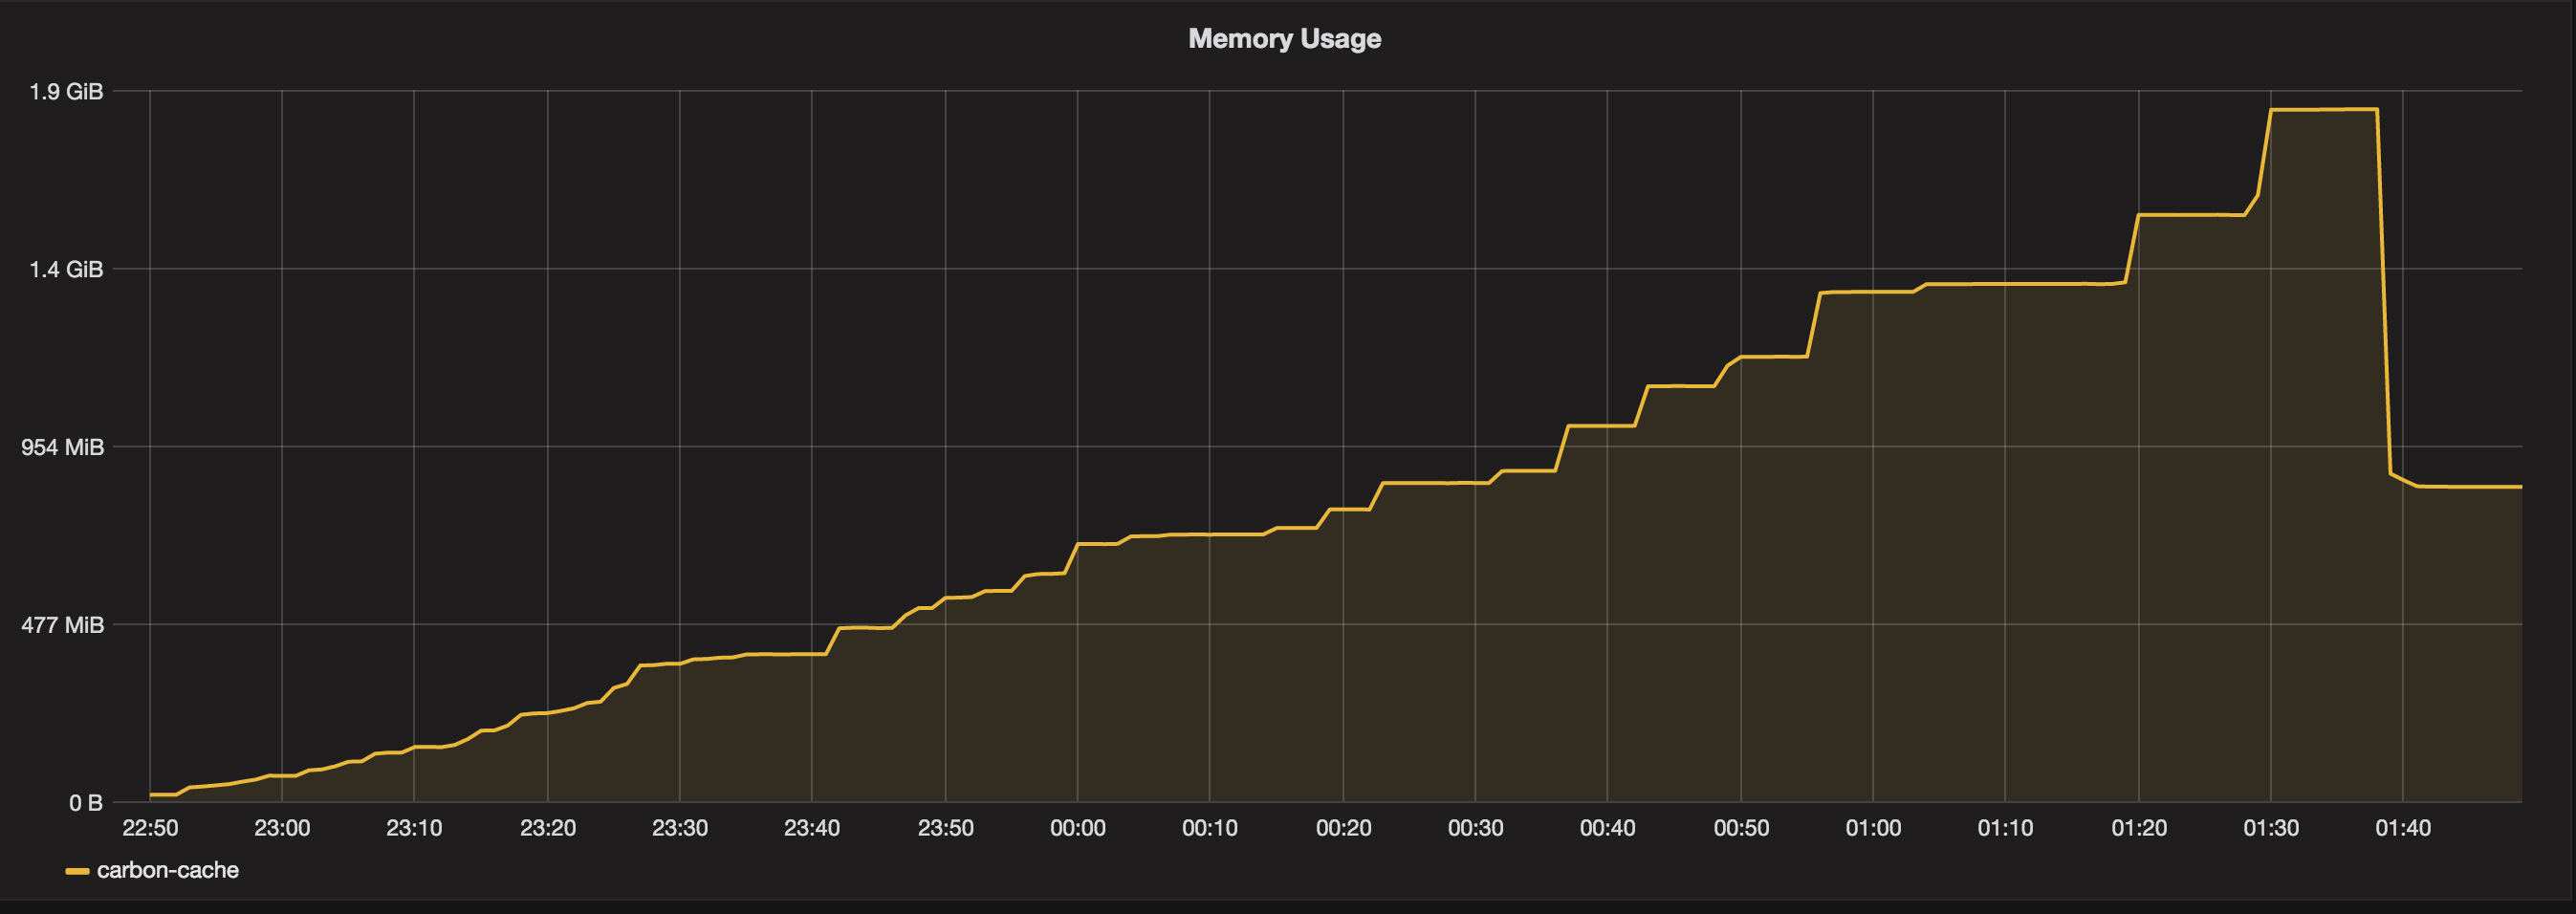
Trial 1
 Trial 2

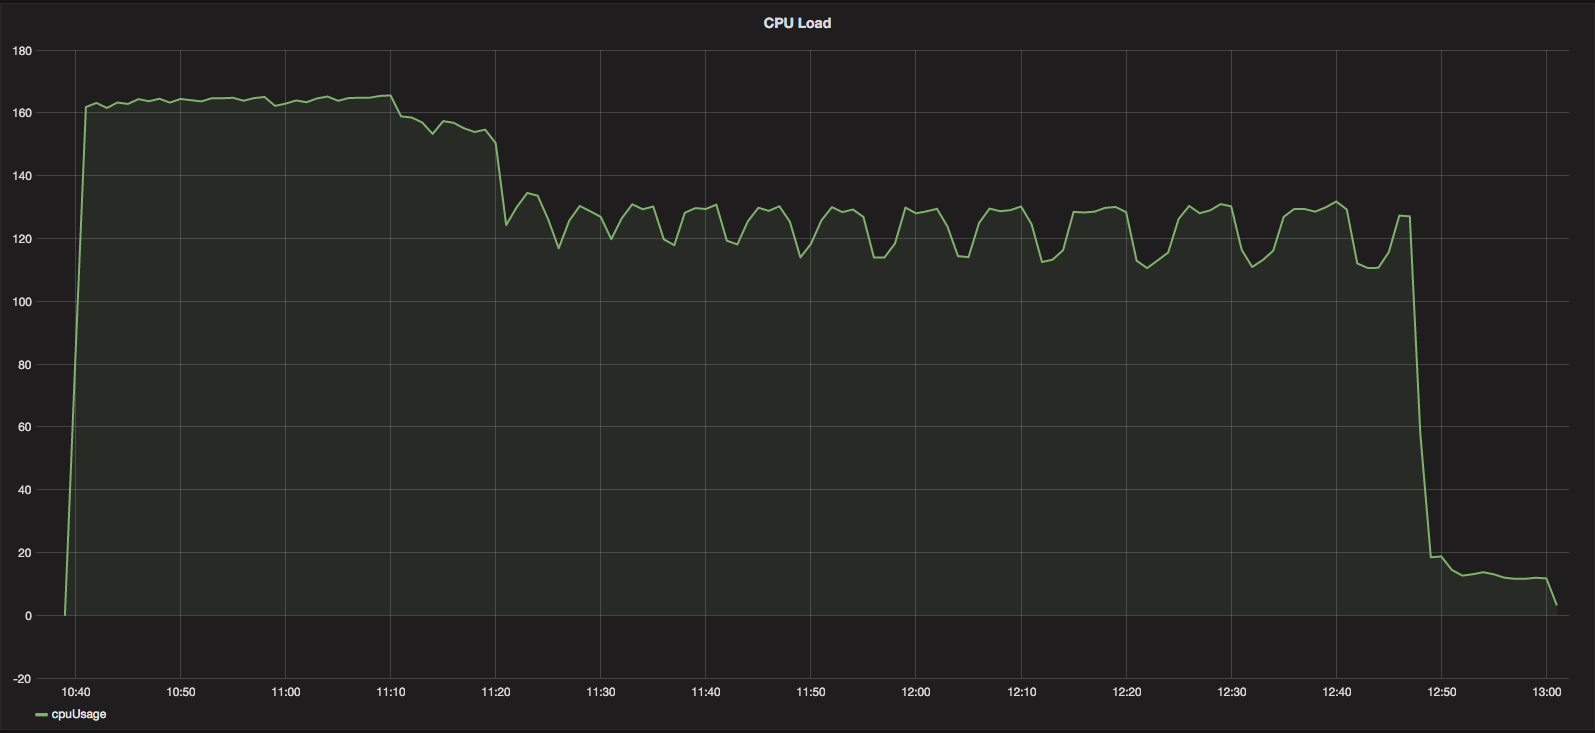
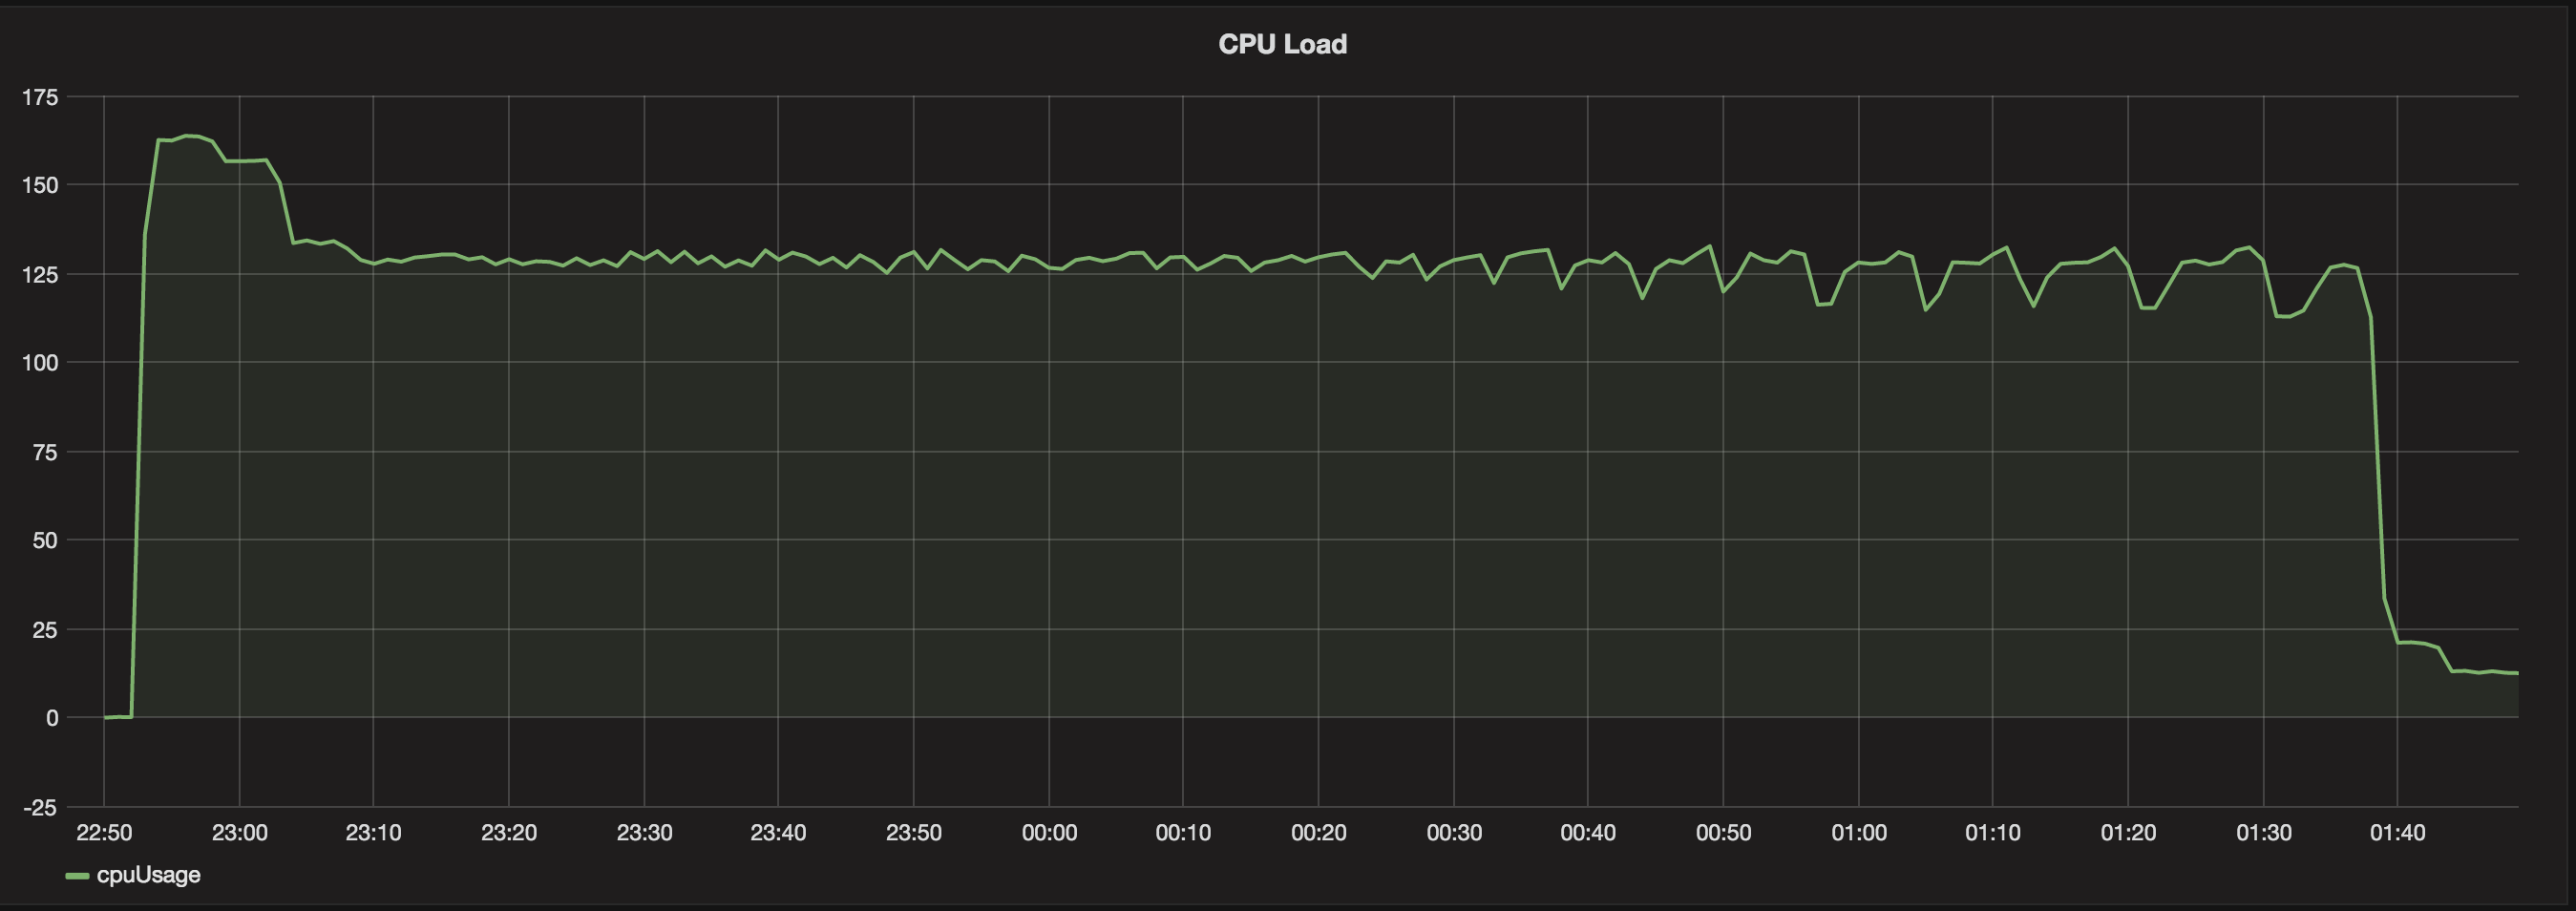
No graph analysis is complete without looking at the CPU, memory and disk operations. The above graphs for the Carbon cache instance match up with the behavior seen in prior graphs (and are consistent with each other). One item of note here is that the disk IOPS are extremely low as compared to the max allowable (300, burstable up to 3000). This is actually pretty obvious given both that we are processing-bound with a single Carbon cache instance, as well as throughput bound by Kinesis only allowing up to 500 reads per second at this time.
Food for Thought
The objective of this test was to figure out whether a single Graphite instance would be sufficient to avoid the operational burden of a sharded Graphite setup (initially) for scalability. This test proved fruitful, and although there are many more data points to explore and much more time required to test, the metrics look good so far.