Troubleshooting Java applications running within a Java Virtual Machine (JVM) can be difficult. From memory/heap tuning to thread deadlocks, knowing different ways to approach problems can be helpful in identifying and resolving root cause. This post talks about an example of an issue that occurred with a Jenkins installation intermittently appearing to “pause”, during which time users were not able to view the Jenkins UI through their browser.
Background
This article attempts to explain one debugging pattern for a Java application running within a JVM on an Ubuntu-based Operating System. This pattern is obviously not the only way to accomplish the identification of root cause for an application degradation in performance, but is a decent start to working through the various items that might cause performance-related issues.
Each section below details the high-level approach to accomplishing the items for the debugging category. In addition, following each section there is a listing of respective commands used (if applicable) as well as short explanations of what each command is intended to do. This is intended to provide a very quick reference for the various commands that are useful in the debugging process. Although some of the commands may seem VERY basic/obvious, they are all included for completeness.
General Approach
There are a few ways to generally approach software problems, starting with the most basic and then progressing further into the stack when you’re not able to find the information you’re looking for. The following steps are how the Jenkins problem were approached, in the order that they were executed.
Logs
First thing’s first - check the Jenkins logs. The most obvious place to start is with the logs for the application you are attempting to troubleshoot to try and identify the obvious issues. Unfortunately, for this particular situation, there was nothing helpful in the logs or indicating any issue. In hindsight, raising the log level would also likely not have proven any fruitful results given the root cause of the issue in the first place.
# watch Jenkins logs real-time
$ sudo tail -f /var/log/jenkins/jenkins.log

# inspect Jenkins log file
$ sudo less /var/log/jenkins/jenkins.log

# inspect OS-level system logs for abnormalities
$ sudo less /var/log/syslog
System Metrics
Next, inspect the system on which the service/JVM is installed. During the time periods of blips in responsiveness, were there any obvious system metrics (CPU, Disk, RAM, Network, etc.) anomalies that could have contributed to the non-responsiveness? For this particular situation, using tools within the cloud-provider if the host is within a cloud provider (such as CloudWatch for AWS, etc) can sometimes provide more insight. Often times, however, the resolution of these tools will not provide enough details related to pin-pointing the issue.
For deeper inspection, using command-line tools such as htop, ps, sar etc. can help further
collect information about CPU, disk, RAM, processes, threads, and the like that when inspected can
help drive to the physical factor(s) that contribute to the slowness. When inspecting htop during
the non-responsive periods, it was noticed that there did appear to be a slight increase in CPU
consumption for a single CPU, but it did not happen during every occurrence. This is, however, a
data point to consider - high CPU can be contributed to by memory/garbage collection, large
and long-running computational tasks and the like. We’ll keep this in our minds as we continue to
forge forward with deeper analysis.
Additionally, the idea that there may be an over-consumption of file descriptors (even in the form
of socket/TCP connections) that could be causing the issue cropped up. File descriptors (as explained
in a previous post) are limited and every resource consumed by an application in the form of actual
file handles, TCP/UDP sockets, etc. count towards the total number of “used” file descriptors. This
means if there is an over-provisioning of TCP sockets or too much latency in the time it takes for an
old TCP socket in the TIME_WAIT state to be re-claimed by the Operating System, the number of file
descriptors counted against the application grows, which can be a problem. To measure, we set up a
small bash script that collected the available vs. consumed file descriptors of the running process,
as well as an overall system-level measurement of the number of active and TIME_WAIT TCP sockets on
the Operating System using the netstat command. In the inspection, we noted that the total number
of file descriptors for the application only ever approached ~2,000 (far below the total number of
available to the process), and the total number of IPv4 connections was steady at around ~500 on the
Operating System (again, far below any OS-level file descriptor limits). This, again, was another
data point, but not the smoking gun we were looking for.
# launch htop
$ sudo htop
# some useful ways to display and organize the data include:
#   't': ordering the processes and threads in tree form
#   'M': Order the processes/threads by memory usage, most consuming first
#   'P': Order the processes/threads by process usage, most consuming first

# find the processes corresponding to anything Java
$ sudo ps -Alef | grep -i java

# get a count of all system sockets in TIME_WAIT state
$ sudo netstat -a | grep TIME_WAIT | wc -l

# get the PID of the Jenkins process programmatically
$ sudo ps -Ao pid,cmd | grep jenkins.war | grep /usr/bin/daemon | grep -v grep | awk '{print $1}'

# get a count of the number of TCP sockets being consumed by Jenkins
$ sudo cat /proc/<JENKINS_PID>/net/tcp | wc -l
JVM Garbage Collection and Heap
A benefit of Java and JVMs over traditional C/C++ implementations (at least when they first came to be) was and still is automatic garbage collection. This topic is the Achilles heel of anyone who is not well versed in Java application development and deployment in JVMs. JVMs handle the “collection” of garbage different ways depending on the garbage collector chosen.
This post is not going to go into the full details of Heap and Memory/GC tuning as that in itself
warrants an entirely new blog altogether. However, at a high level, a JVM requests that the Operating
System allocate (based on switch parameters provided to the JAVA_OPTS variable for a JVM) memory
for the “heap”, which is a block of memory that the JVM will use/expects to use. As the application
within the JVM operates, it generates objects and resources that fill up the memory in the “Young” or
“New” generation space. Young generation garbage collection routinely cleans up this data as it
approaches the total allocated size of the Young generation space, which occurs very quickly given
that the space is not generally very large. As objects and resources persist through garbage collection
cycles, however, they are eventually placed in the “Old” generation space. This space is typically
much larger and, as such, is intended to not be garbage collected as frequently since a GC on this space
results in a pause in the application. Tuning the JVM heap is a complicated process that requires an
initial analysis of the application for long-lasting objects followed by monitoring usage of the heap
and finally, tuning the available young/new-gen and old-gen spacing. Although this sounds simple and
straightforward, this can actually be a very long and drawn-out process with many trial and error
attempts and typically requires decent understanding of the more granular spaces within the Young and
Old generation heap.
Garbage Collection Logs
One of the first things you can do in determining if garbage collection is causing “stop the world”
performance-based issues is turn on garbage collection logging within the JVM JAVA_OPTS configuration.
Specifically, adding the following switches to the JAVA_OPTS variable will enable this:
-Xloggc:/var/log/jenkins/jenkins-gc.log
-XX:+PrintGCDetails
-XX:+PrintGCTimeStamps
Note that the above will write the garbage collection information to the log file in the Jenkins log
directory but will NOT rotate the logs, meaning you must either handle this yourself (via other
Java switches or logrotate) or remember to shut off GC logging when you are done with inspection. Once
you provide the above options to the JAVA_OPTS variable and restart the JVM, you should be able to
inspect/see logs in the /var/log/jenkins/jenkins-gc.log file. For this Jenkins installation,
inspecting the logs over long durations of time indicated that only Young generation garbage collections
were being performed and the GC activities were short-lived and consistent in freeing up memory. In
addition, there were no full GC cycles performed and, during the periods of non-responsiveness, Young
generation GC continued to operate (indicating no issue with GC).
You can also take the GC logs and run them through a Garbage Collection analysis tool in order to get a more complete/programmatic determination of whether there are Garbage Collection tuning opportunities to help optimize the GC parameters. In this scenario, the GC tools did not discover any optimizations to be made.
JConsole
The most basic GUI tool for interaction with a JVM is JConsole, which typically comes pre-installed
with any Java installation. JConsole is a metrics and MBeans tool that allows you to connect and gain
insight into the operation of the JVM itself as well as the application using the
Java Management Extensions (JMX)
technology. JMX is not typically enabled or exposed within a JVM by default but can be exposed via
adding the following switches to the JAVA_OPTS environment variable during startup:
-Dcom.sun.management.jmxremote
-Dcom.sun.management.jmxremote.port=1099
-Dcom.sun.management.jmxremote.ssl=false
-Dcom.sun.management.jmxremote.local.only=false
-Dcom.sun.management.jmxremote.authenticate=true
-Dcom.sun.management.jmxremote.access.file=/opt/tomcat/current/conf/jmx.access
-Dcom.sun.management.jmxremote.password.file=/opt/tomcat/current/conf/jmx.password
Note: A full explanation and details behind why to use authentication with JMX can be found in this previous post, which also explains how to implement the JMX access and password files and why you might want to enable SSL as well.
Once you have configured the above for the Java options and restarted the application, you can then
launch JConsole and access the JVM via the connection string <IP_ADDRESS>:1099. When prompted, enter
the JMX username and password for either the read-only or read-write roles that you have defined for
the user. You should then be connected to the JVM and be able to see various initial information. You
will see things such as heap usage, number of threads, CPU usage, memory usage overall, etc. In
addition, you can see items such as Young/Old generation heap garbage collection cumulative times
and total collections, information about running threads, and classes loaded/unloaded.
For the Jenkins troubleshooting, one important thing to note were the heap metrics. Specifically, there were many garbage collection activities on the Young generation portion of the heap taking a very small amount of time overall. In addition, there were absolutely no garbage collections performed on the Old generation, indicating that Old generation garbage collection (“stop the world”) was not likely the culprit.
VisualVM, VisualGC, JStatd
Another very useful tool is the VisualVM product. In my opinion, this
tool is far more detailed than the JConsole tool and provides almost all information that JConsole
typically provides, making it a normal go-to for my JVM debugging. In addition, the
VisualGC plugin (can be installed
directly within VisualVM via the “Plugins” option) is extremely helpful in inspecting heap usage via
graphs. However, in order to glean the benefits of the nice graphs VisualGC provides, you need to
ensure that the jstat
daemon is running on the Jenkins host as this is the communication technology that VisualGC requires
to graph the heap information. In order to start/run the jstatd daemon on the Jenkins host, you
first need to create a policy file to avoid a “Permission Denied” exception when attempting to start
the daemon:
$ sudo vim /tmp/tools.policy
# ensure the file contains the following:
#   grant codebase "file:${java.home}/../lib/tools.jar" {
#       permission java.security.AllPermission;
#   };
Once you have created the policy file, you can start the jstatd daemon as follows:
$ sudo jstatd -J-Djava.rmi.server.hostname=<JENKINS_IP> -J-Djava.security.policy=/tmp/tools.policyLet the daemon process continue to run and now open the VisualVM application on your Laptop/Desktop. Create a new host via the “File” -> “Add Remote Host…” option and use the IP address of the Jenkins host. Once the device shows up under the “Remote” drop-down, right click on the host and select “Add jstatd Connection”. When prompted, you can likely accept the default port “1099” and refresh interval of “3 seconds”, then click “OK”. If successful, you will see the Jenkins “.war” application show up under the host in the drop-down menu. Double-click the application to open a window showing initial details about the application.
Overview of the heap usage, number of threads, and number of classes loaded/unloaded can be seen in the “Monitor” tab as shown below:
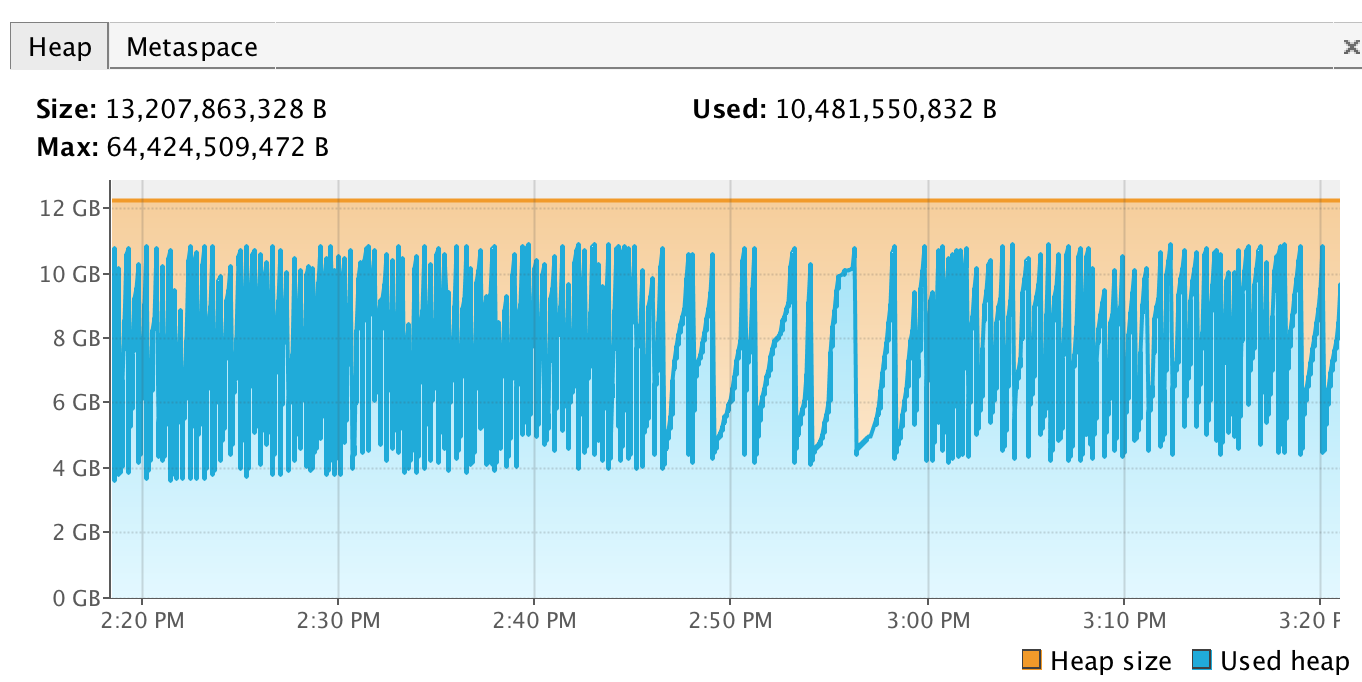
In this case, saw tooth-like “usage” of the heap indicates that the garbage collector is effectively cleaning up the garbage in the used heap. For more details (and in the Jenkins troubleshooting case, the tab most useful in the VisualVM application window), visit the “Visual GC” tab, an example of which is shown below:
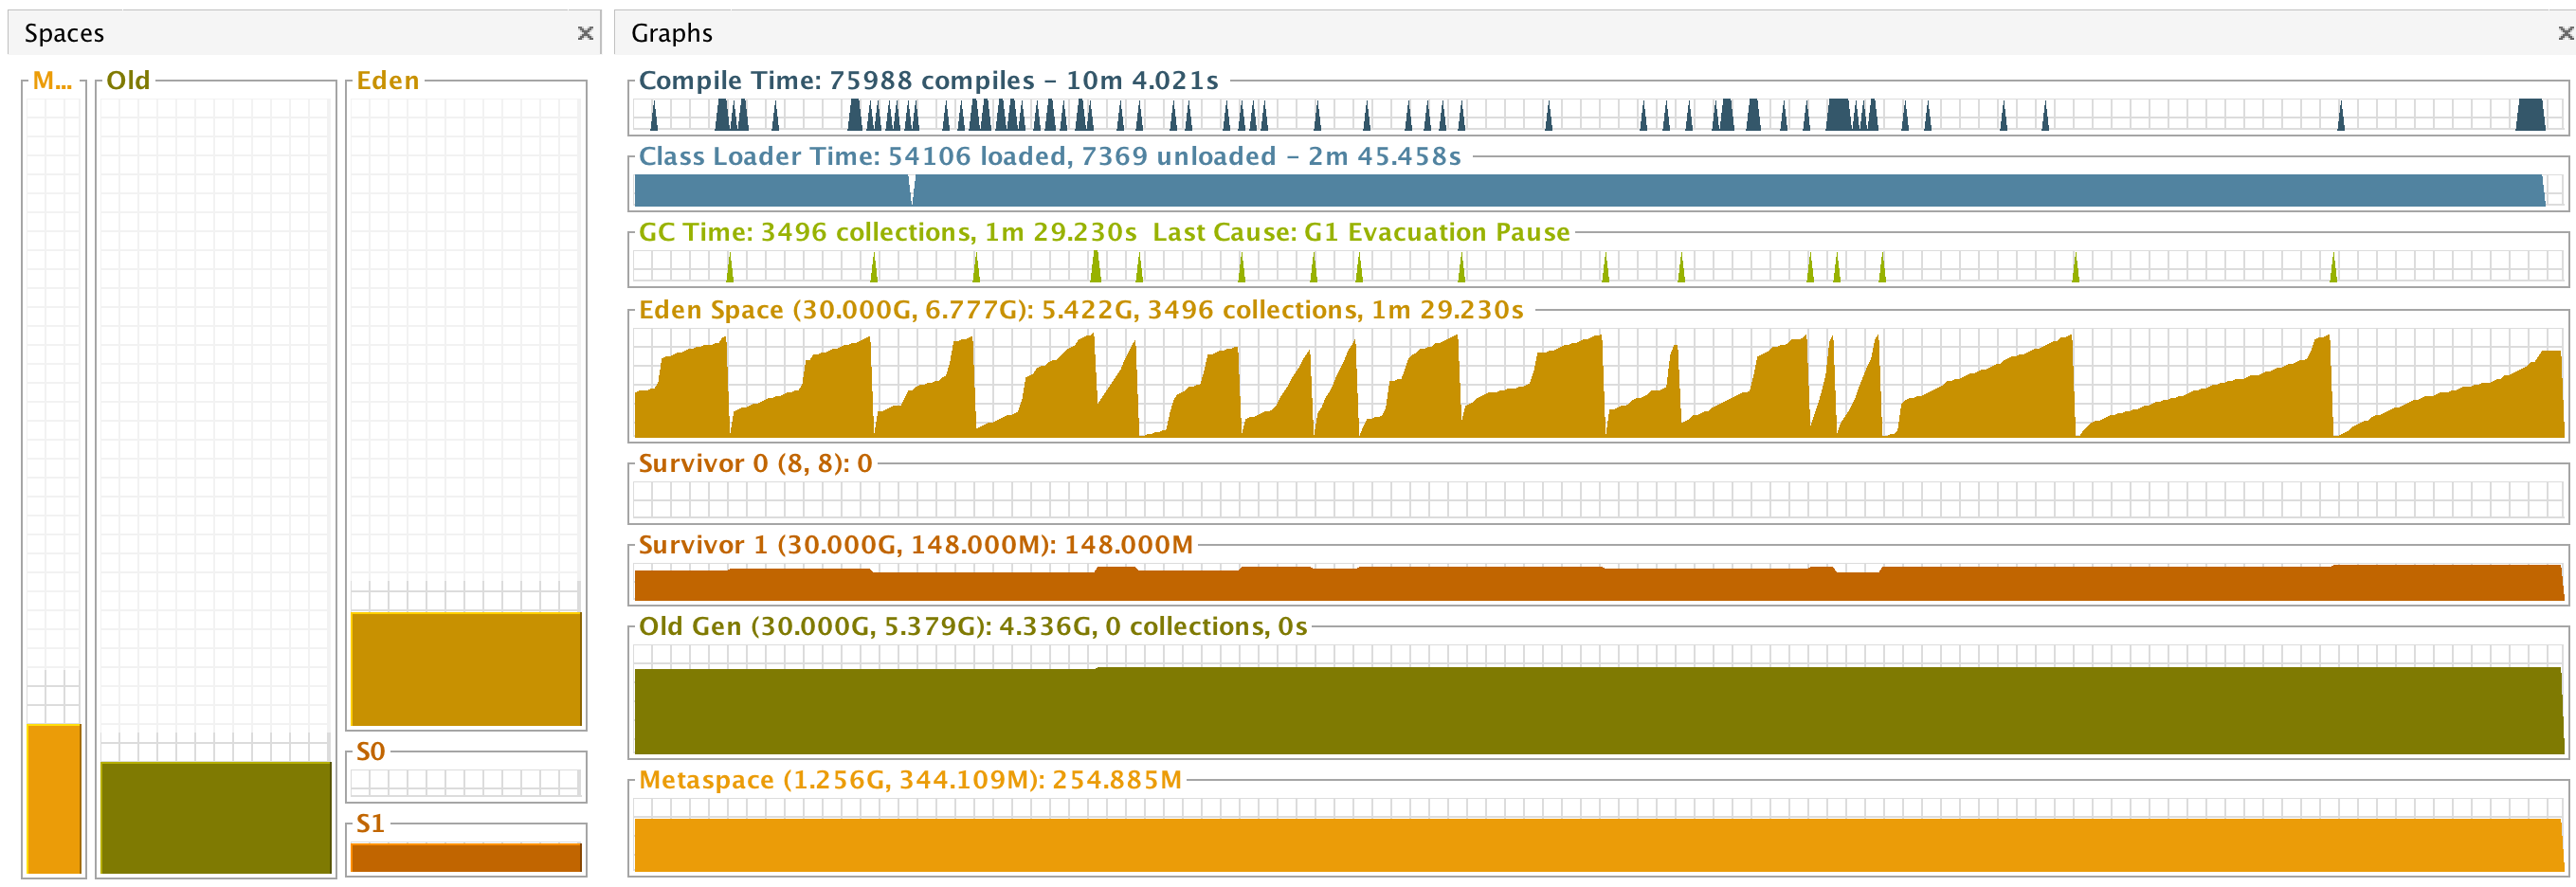
The graphs in the window demonstrate the current state of the JVM heap as well as details about garbage collection activities that are/have taken place in the respective areas of the heap. Upon inspection and watching the graphs over time, it was clear in this troubleshooting case that our previous inspection of heap/GC using JConsole proved true (no issue with heap or GC tuning) given that the Young generation spaces were routinely being garbage collected and the Old generation space was VERY slowly creeping up but no garbage collection was being performed. The saw tooth-like graph of “Eden Space” was a good indication that Young generation GC activities were working effectively/ efficiently. Again, pretty good indication/clarity that the JVM heap and garbage collection are not issues related to the blips given that the graphs were stable/consistent during the performance degradation.
Heap Dump
For completeness in analysis, if there was an indication of a heap-related issue, we could perform a heap dump and inspect the heap for what might be consuming the heap. In the Jenkins case, all signs related to the heap and the garbage collection activities indicated both a healthy heap allocation and garbage collector performance - however, had there been a heap/GC issue, you can run the following command to perform a heap dump of the JVM heap, which can then be inspected in a heap analysis tool.
WARNING: This command will result in a complete pause of the JVM (and therefore, the application) for the duration of the heap extraction. For larger heap sizes, this time can be substantial, resulting in an apparent “outage” to your customers.
# obtain the Jenkins PID (will be the Jenkins war shown in this command)
$ sudo jps -l

# perform the heap dump
$ sudo jmap -dump:format=b,file=/tmp/jenkins_heap.bin <JENKINS_PID>
As stated prior, in the case of this Jenkins troubleshooting, all signs indicated that heap/GC were healthy and therefore, no heap dump was performed. Had we done a heap dump, however, we would have needed to account for a length of time during which Jenkins was unavailable given that the heap was set to 30 GB maximum and around 12-13 GB was actively being used (another point summarized towards the end of this post related to over-allocation).
JVM Threads
Given that the above items thus far have ruled out system-level, memory, heap, and garbage collection issues as they relate to performance degradation, the next step is to look at the JVM and application threads to determine if there is a bottleneck, deadlock, or some other issue related to the application itself that could be causing the issue. For this, there are a few different ways that this can be accomplished - we approached this from several angles, some of which were free/typical in JVM troubleshooting and others which were paid and provided value-add in analysis of the metrics.
Thread Dump
The first and most simple of things to do is perform a thread dump. This can be accomplished in
several ways, but the one utilized was corresponding to usage of the jstack command. The process
is quite simple - identify the process ID of the JVM application and use the jstack command in
conjunction with the process ID to perform the heap dump:
# capture the Java process ID of the Jenkins war
$ sudo jps -l

# perform a thread dump and output to the file 'jenkins_threads.tdump'
$ sudo jstack <JENKINS_PID> >> /tmp/jenkins_threads.tdump
Typically, you would want to perform several successive thread dumps and perform an analysis over a period of time. What you are looking for are things like deadlocks, an abundance of blocked threads, etc. Thread analysis is a more complicated subject that most likely warrants its own discussion thread so we will not attempt to summarize it here, but in general, seeing whether you have deadlocks occurring is essentially a minimum inspection that can somewhat easily be performed via inspecting whether multiple threads are all blocked and waiting on each other to release information or availability of a shared resource, resulting in a deadlock. If there was a CPU/performance-based issue that you could identify the process ID of the thread, you could also convert the process ID to hex and identify specifically what the thread was doing in the thread dump (via the ‘nid’ in the thread dump, which is the hex ID of the thread) using this hex number.
In addition to manual inspection, there are also many tools that can take thread dumps and perform a quick analysis of the thread dump and identify more possible issues related to the way the application is performing. In the Jenkins case, no smoking gun was gleaned from the thread dump specifically.
VisualVM
Back to the trusty VisualVM application. Another nice feature of this application is the ability to inspect threads running within the JVM. You can certainly obtain the running threads from the thread dump performed prior, but to get a bit more detailed information about the threads in a slightly different format is always helpful.
In the application window for the Jenkins webapp, click on the “Threads” tab to access information about the threads within the JVM. From the drop-down menu, select “Live Threads Only” to display only those threads currently alive - this will ensure that dead threads do not clutter the view. In our case, monitoring the threads during outages was helpful in pinpointing some very specific items related to the activities within the JVM. Although this is slightly a “search in the dark with a candle” activity (as you will need to scroll up/down through the thread list looking for abnormalities), the length of time for the non-availability of Jenkins was enough for us to notice the same thread activity occurring during those non-availability timeframes (shown below with specific details redacted):
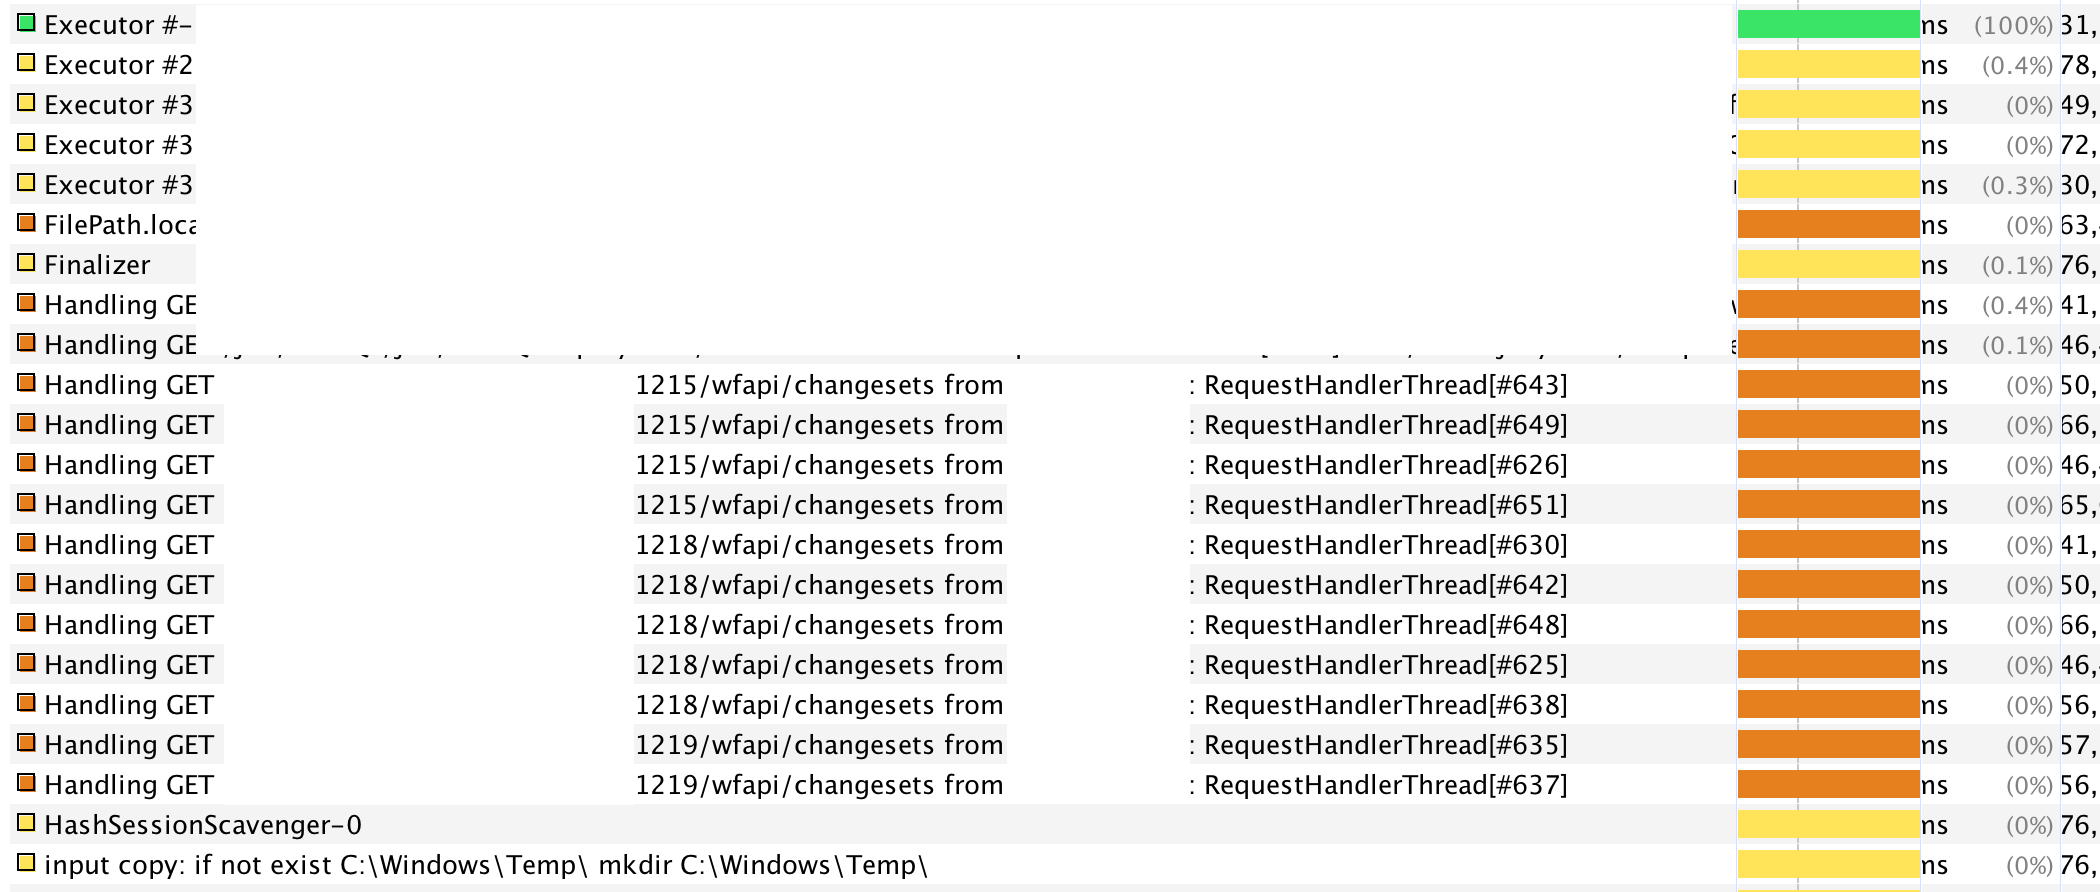
If you look closely you will see that there were several GET requests for URLs corresponding to the “changesets” endpoints for specific jobs. While this does not seem too abnormal, there were two specific issues I had with this:
- These threads seemingly popped up always and only when the non-availability of Jenkins was occurring.
- Although grayed out, there were essentially 2 separate IP addresses making 2 requests each of the same endpoint resource URL (total of 4 concurrent requests to the same “changesets” URL at a time).
In addition, not shown is a thread that indicated a call out to an LDAP endpoint (specifically, Active Directory) that again always popped up when these threads were running and Jenkins was non-responsive. Digging into this further, we decided to also take what’s known as a “Thread Profile” via the APM product to dive deeper into the call stack, which is explained in the next section.
Application Performance Monitoring (APM)
Application Performance Monitoring (APM) is a hot topic these days in terms of monitoring your distributed application environment. Many of these tools provide ways to deep-inspect the code base of running applications, thread stacks within JVMs, etc. Given the previous thread profiler via VisualVM was able to give us some information related to several suspicious threads that always popped up for multiple concurrent GET requests of Jenkins whenever Jenkins was non-responsive, we decided to use an APM tool to perform a deeper trace of the call stack of the application.
When an issue occurred and Jenkins was non-responsive, we ran a profiler against the Jenkins JVM. This profiler was able to detect and map all running threads at the time and give us deep insight into the call stack of the JVM. Upon inspection, it was found that many recursions of calls were performed in the winstone application (the default web server framework for Jenkins) and, digging deep into the hundreds of call sequences we discovered many various references to an Active Directory plugin along with LDAP connection calls. This seemed in line with the previous thread inspection being performed and, as such, we were able to further confirm our hypothesis that these specific threads may be causing issues.
Network Tracing
Finally, network tracing. Given that the previous thread dumps indicated a pattern that each and every time the Jenkins application was unresponsive there were ~3 corresponding events occurring, we can start to pinpoint the issue and ensure we are down the correct path. Specifically, the events and data during the apparent non-availability were:
- 6-8 threads making GET requests to a specific Jenkins path for “changesets”.
- Thread indicating communication with an LDAP endpoint.
- Deep thread analysis in the APM analysis indicating deep recursion and loading of the Active Directory and LDAP plugins.
To test that our hypothesis was correct (the above are pinpointing the root cause), we attempted to
reproduce the issue via issuing GET requests of the endpoint at the same time as tracing the network
traffic incoming/outgoing for that endpoint port. The tcpdump tool is useful for this type of
activity, so we will first start the tcpdump tool on the Jenkins host against the destination port we
saw in the single thread listed in VisualVM showing outgoing connections to the LDAP endpoint on port
3268:
# watch all TCP traffic where the destination port is 3268 with:
#   'n': do not convert addresses to names
#   'X': print the data for each packet captured
#   'S': print absolute TCP sequence numbers
#   's': grab an unlimited number of bytes from the packet trace
$ tcpdump -nXSs 0 dst port 3268
Once the tcpdump command is running, open several terminal windows and issue a curl command for a
GET request to the specific endpoint the threads were referencing (one of the .../wfapi/changesets
paths). In doing so, we were able to realize a LOT of data in the tcpdump command, the curl
commands not returning for quite some time, and (hooray), Jenkins completely freezing/the web UI
becoming unresponsive. At this point, we knew exactly the trigger to reproduce the issue and what was
causing our non-responsiveness of the Jenkins platform.
Root Cause and Summary
Identifying intermittent and seemingly random system issues can be extremely cumbersome and difficult. In this particular case, it took a team of engineers and several hours of debugging over days in order to formulate the correct pattern of investigation that eventually led to the discovery of the trigger that caused Jenkins to become unresponsive. Ultimately, the root cause was driven down to the fact that the Jenkins Pipeline plugin causes these GET requests to occur whenever someone visits the pipeline page of the application. Specifically, the Pipeline plugin attempts to obtain a listing of the changesets for a particular job. In doing so, it in turn triggers the Active Directory and SCM plugins, which were configured to perform name translation of the committers of each commit corresponding to the actual Active Directory name for the individuals. While this is seemingly not a huge deal for those jobs that only include a couple/few commits, it is an extremely expensive operation for those jobs that include dozens or hundreds of commits and, given it is a blocking operation, it can cause complete unresponsiveness of the Jenkins platform. To avoid this from happening, we were able to add the following switch to the JAVA_OPTS variable which prevents the Jenkins instance from translating the names (performing the LDAP lookups of each and every commit):
-Dcom.cloudbees.workflow.rest.external.ChangeSetExt.resolveCommitAuthors=false
In summary, troubleshooting is difficult and complicated. Taking the time to learn the components of the software, the frameworks and servers they are installed on/in, and digging deep with real data and metrics is the only way you can possibly drive to root cause for such complicated issues. In the end, sometimes it just feels as though it will be impossible to identify root cause for an issue - at this specific point it is most important to take the time, dig in, and get your hands dirty with deep metrics and data that you can use to correlate and drive to root cause, whatever the effort.
Fringe Benefits
Sometimes when troubleshooting application issues you stumble upon other performance, operational,
or other issues that can be resolved. In this Jenkins troubleshooting we were able to identify
through the graphs and metrics displayed in the tools that we were very over-provisioned in the
heap sizing of the JVM. Specifically, our JVM was tuned to have a maximum heap size of 30 GB while
the graphs over a semi-long period of time (days) showed that we were only consuming a maximum of
~12-13 GB. This allowed us to re-size our VM using a smaller AWS EC2 instance size and decrease the
total Maximum heap size -Xmx which provided two benefits:
- Decreased cost: Given the EC2 instance resulted in an over-provisioned instance for our needs, we were paying far more (2-3x more) for the instance and reducing the instance type saved us money overall.
- Increased performance: In reducing the overall heap size (and, in turn, the overall available heap for Old generation), a full garbage collection of Old generation heap would take less time due to the reduction in the overall Old generation heap size, thus reducing the amount of time the application would appear unavailable to our customers for “full” garbage collection cycles.
Credit
The above tutorial was pieced together with some information from the following sites/resources: