Pass 2 at a previously implemented approach to tuning a Graphite instance on an Ubuntu 16.04 virtual machine. As seen in previous attempts, CPU binding is very much an issue when there is sufficient memory in place as a single Carbon instance consumes 100% of CPU. This pass will implement a Carbon Relay in front of two Carbon Cache instances in an attempt to spread the load out across multiple CPUs.
Background
After implementing a Graphite instance which had a single Carbon Cache that was being fed metrics from a Kinesis stream as fast as Kinesis could serve the data, it became quite apparent that the single Carbon Cache instance approach using an SSD drive ended up being CPU bound on both an m3.xlarge and t2.large instances. However, the t2.large instance kept up and lasted longer than the m3.xlarge instance due to the increase in CPU performance and AWS CPU boost credits that allowed it to run the single Carbon Cache instance more effectively.
Due to the GIL (Global Interpreter Lock) in Python, which effectively prevents multiple native threads from executing Python bytecodes at the same time, it is not possible to have a single proc with multiple threads consume different CPUs/Cores. In cases where disk I/O is sufficient (as is normally the case for a single Carbon Cache instance running on an AWS instance that has SSD-backed storage), Carbon Cache will effectively be CPU bound, causing memory to increase because the sorting cannot happen fast enough for the metrics to be written to disk.
This next approach at Graphite tuning implements a tiered approach to Graphite in an attempt to expose I/O binding due to sufficient CPU consumption by multiple Carbon Cache instances. The architecture is such that there are 2 Carbon Cache instances on a single host, along with a single Carbon Relay instance that uses consistent hashing to send metrics to one of the two Carbon Cache instances. In this setup, where each Carbon Cache instance as well as the Relay are separate processes, CPU consumption should be more well balanced, effectively exposing Disk I/O as a potential binding agent.
Setup
In order to set up this test/experiment, instantiate and configure an AWS instance with a Carbon install and configuration according to this post. However, at the step where the carbon.conf file is being configured, in addition to the installation instructions specified, ensure that the following configurations are used to enable a second Carbon Cache instance along with a Carbon Relay:
# update/un-comment the following configuration parameters in the carbon.conf file - note that these
# settings are partially contained under the [cache] section - move these settings into their respective
# [cache:a] and [cache:b] sections as listed below (all other settings for cache:a and cache:b will
# be inherited from the general [cache] section
#   [cache:a]
#   LINE_RECEIVER_PORT = 2103
#   PICKLE_RECEIVER_PORT = 2104
#   CACHE_QUERY_PORT = 7102
#
#   [cache:b]
#   LINE_RECEIVER_PORT = 2203
#   PICKLE_RECEIVER_PORT = 2204
#   CACHE_QUERY_PORT = 7202
#
# next, ensure that the [relay] section is enabled by ensuring the following lines are uncommented/configured:
#   [relay]
#   LINE_RECEIVER_PORT = 2003
#   PICKLE_RECEIVER_PORT = 2004
#   RELAY_METHOD = consistent-hashing
#   DESTINATIONS = 127.0.0.1:2104:a,127.0.0.1:2204:b
In addition, at the step where the Graphite Web local_settings.py file is configured, ensure the following configurations are specified in addition to the original instructions:
# update the following configuration parameter in the local_settings.py file
#   CARBONLINK_HOSTS = ["127.0.0.1:7102:a", "127.0.0.1:7202:b"]
Once the configuration files are in place, work through the remainder of the installation/configuration steps in the previous post until the step to start the Carbon Cache instances. Instead of running the start commands listed in that step, perform the following start sequences/validation for each Carbon Cache and Relay instance:
$ sudo -E /opt/graphite/bin/carbon-cache.py --instance=a start
# Starting carbon-cache (instance a)
$ sudo -E /opt/graphite/bin/carbon-cache.py --instance=a status
# carbon-cache (instance a) is running with pid 12022

$ sudo -E /opt/graphite/bin/carbon-cache.py --instance=b start
# Starting carbon-cache (instance b)
$ sudo -E /opt/graphite/bin/carbon-cache.py --instance=b status
# carbon-cache (instance b) is running with pid 12023

$ sudo -E /opt/graphite/bin/carbon-relay.py start
# Starting carbon-relay (instance a)
$ sudo -E /opt/graphite/bin/carbon-relay.py status
# carbon-relay (instance a) is running with pid 12143
Now that both Carbon Cache instances and the corresponding Carbon Relay instance are running, continue with the previous post instructions for starting Graphite Web (Apache) and performing validation. Note that for the validation steps, you should now see ‘a’ and ‘b’ for Carbon Cache PID files and processes, and ‘a’ for a Carbon Relay PID file and process.
Once verification/validation is complete, set up a Kinesis stream pull/forwarder to pull Kinesis stream data that has sufficient data within it at the maximum rate Kinesis will allow. Forward the data to the Carbon Relay listening on TCP port 2003, which will then forward the metrics along to the corresponding Carbon Cache instances using the consistent hashing algorithm as defined in the carbon.conf configuration.
Results
The results of the re-test using the same stream from Kinesis as the original post were quite telling. Performance on the m3.xlarge instance improved DRASTICALLY in the sense that the Carbon Cache instances were processing and writing to disk more than fast enough to keep up with the incoming stream such that the memory on the EC2 instance remained below 1GB (in fact, the entire instance memory remained mostly below 500MB for a good while). Taking a look at the graphs…
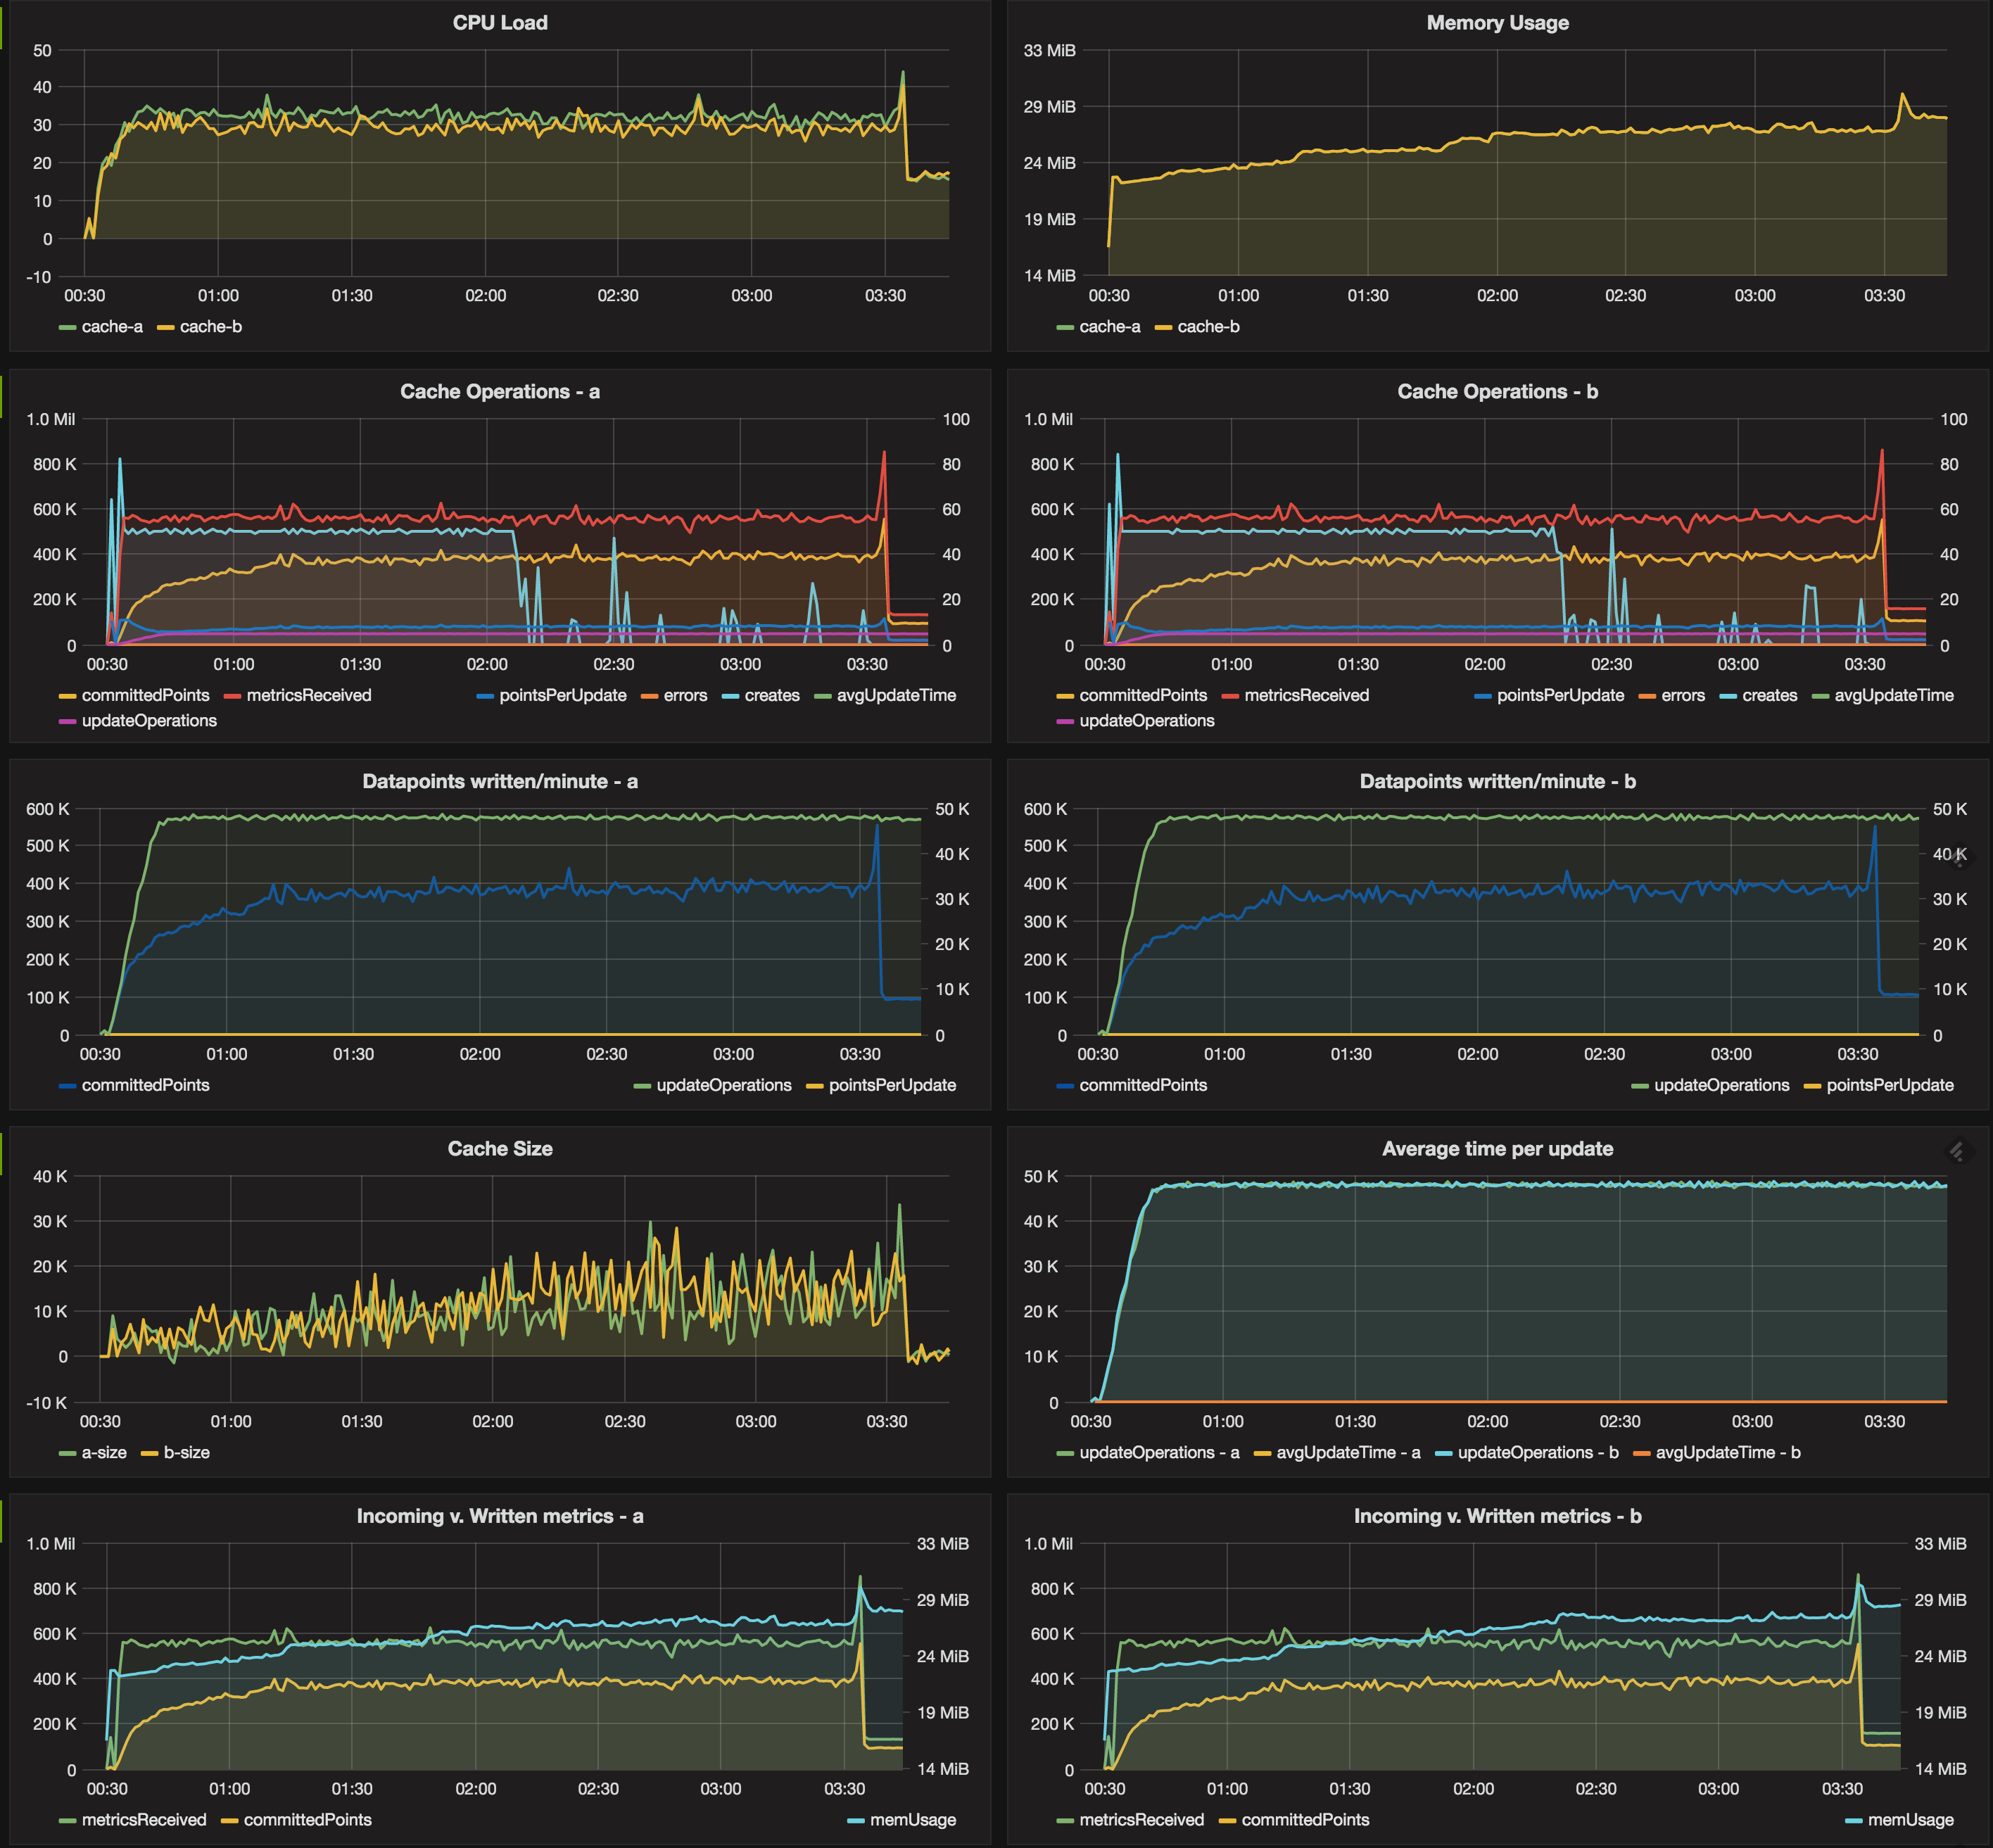
The above overall dashboard is slightly different than the original post/trials. In learning more about how Graphite operates via reading through the code base a bit for the Graphite Web and Carbon Cache/Relay components, some of the graphs were adjusted slightly to give a bit more useful information.
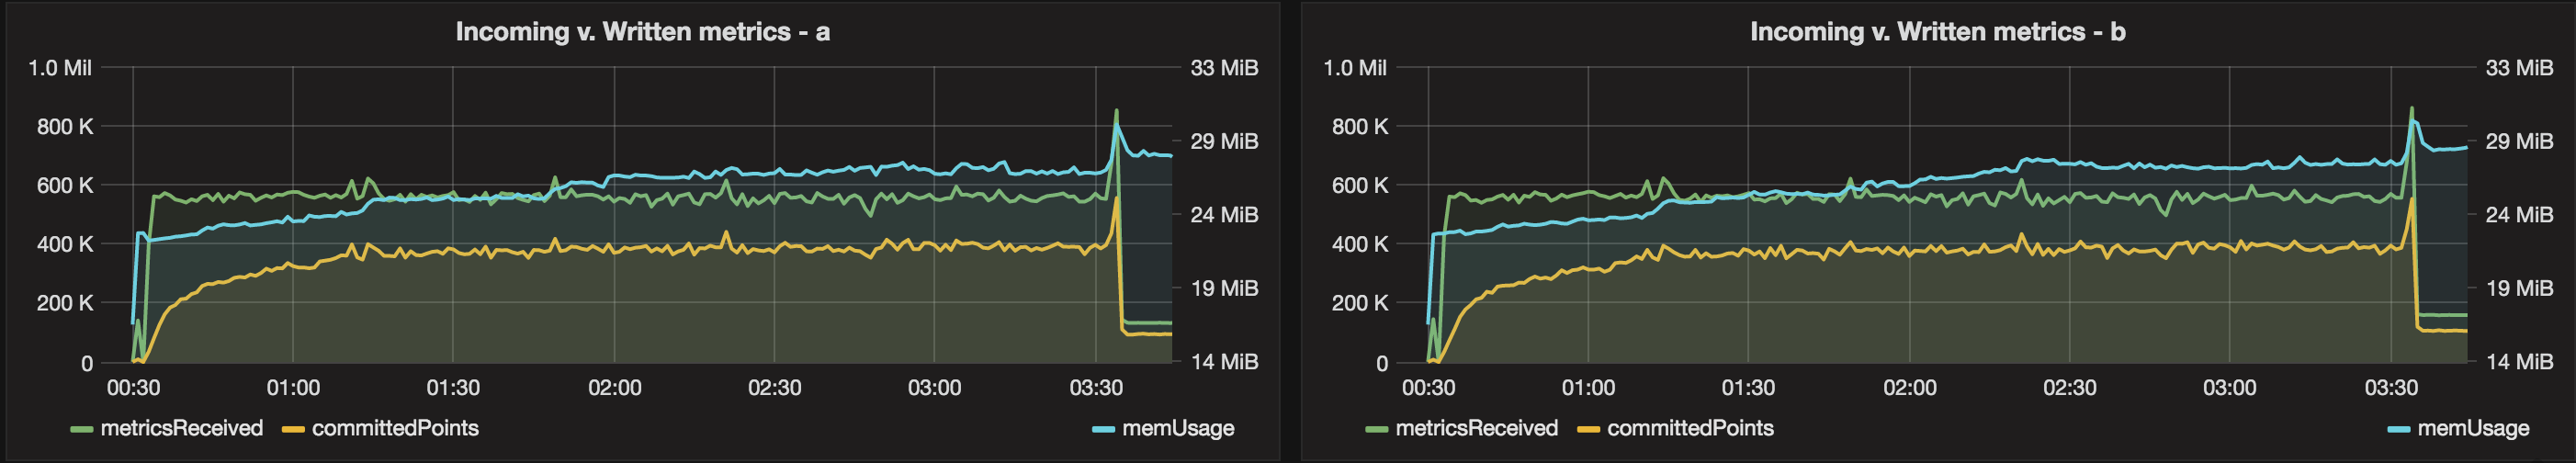
Incoming metrics were hitting each Carbon Cache instance at a rate of about 500k-600k/minute, meaning the Relay was taking in around 1M-1.2M metrics/minute (16,667-20,000 metrics/second). This is quite a bit different than the original tests performed in that the Relay seems to have been throttling the incoming data (bottleneck) - this is a somewhat known issue, and for the purposes of this exercise, we will simply accept this. In the future, I may try to re-run the test with the Carbon C Relay that was written to address this specific issue (also see my note in the Conclusions section related to disk IOPS and further tuning of the out of box Carbon Relay)
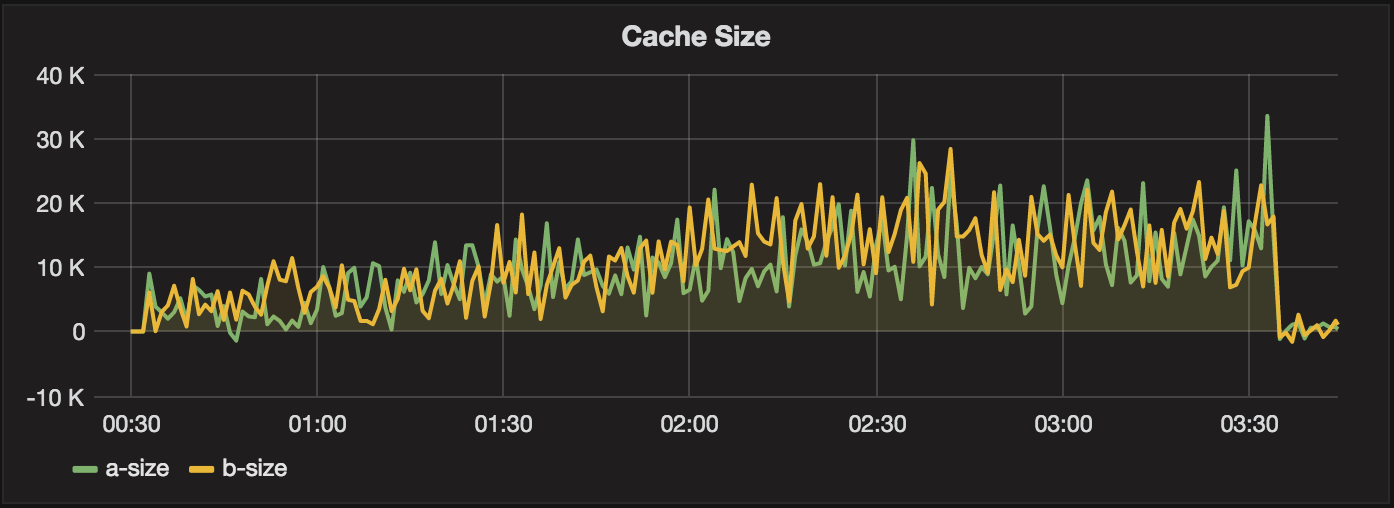
Cache sizes for each of the Carbon Cache instances remained farily consistent between 0-20k. There was an ever-so-slight upwards slope in the cache size, but so little it was barely noticeable.
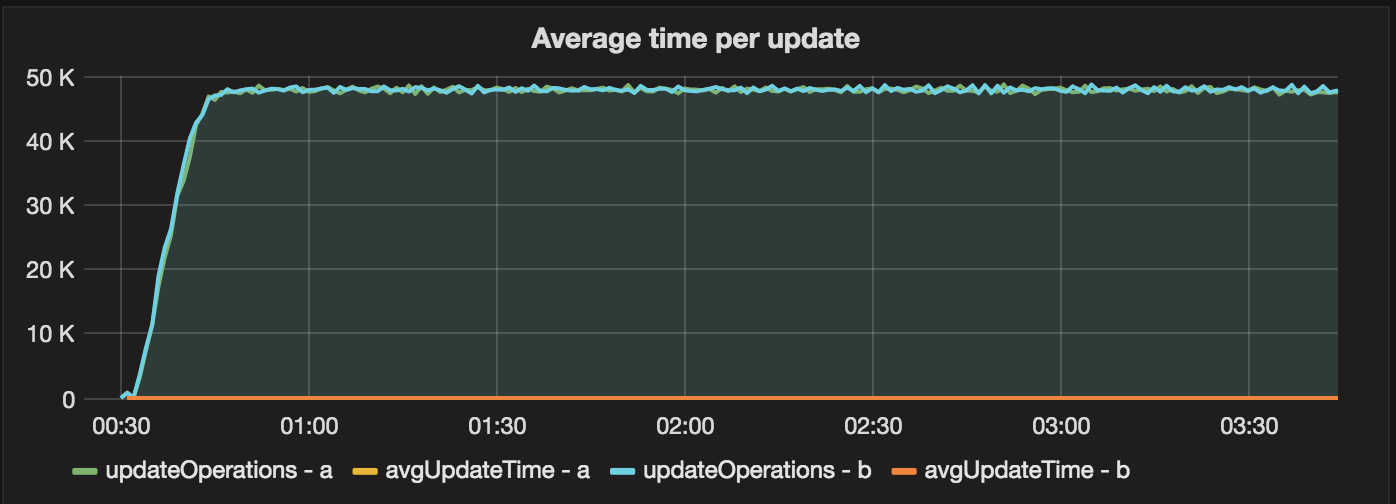
Average times for update operations was negligible, demonstrating the disk was keeping up fairly well. Total updates operations floated at around 47.5k.
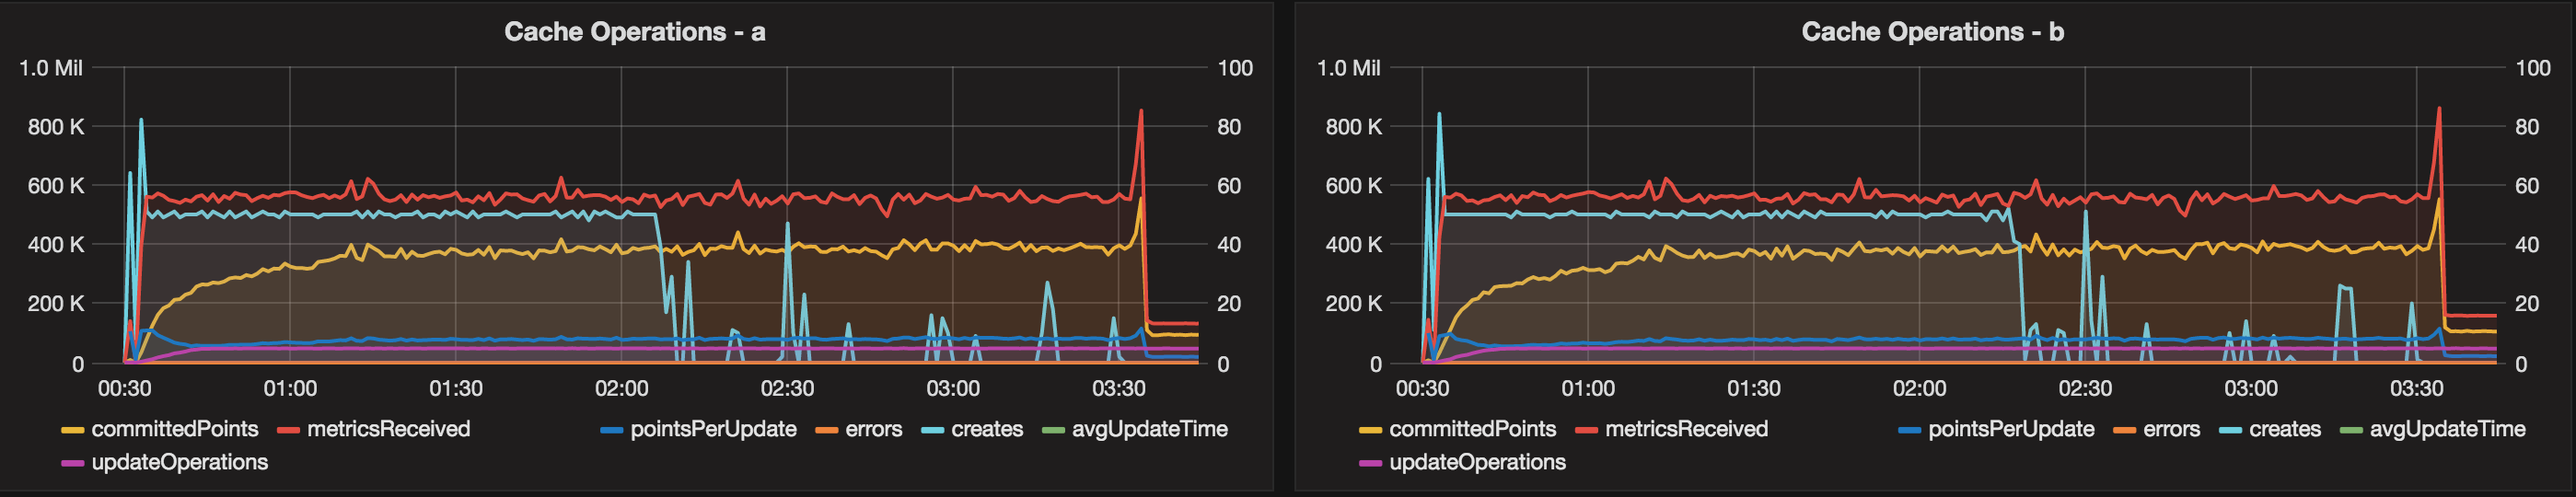
The cache operations graph proved to be quite interesting in comparison to the past tests. Committed points lagged behind metrics received by about 200k for quite a while. However, the ingest rate (metricsReceived), although lower than past tests (around 1.2M/minute total between the two Cache instances), was much more consistent throughout the test.

CPU load was quite low, which was an improvement from the last test and proves the theory that CPU-binding can be resolved via launching multiple Carbon Cache instances (even if the Relay then becomes a bottleneck and throttles incoming metrics). Memory remained extremely low in comparison to previous testing, which was also a fortunate outcome of this test.
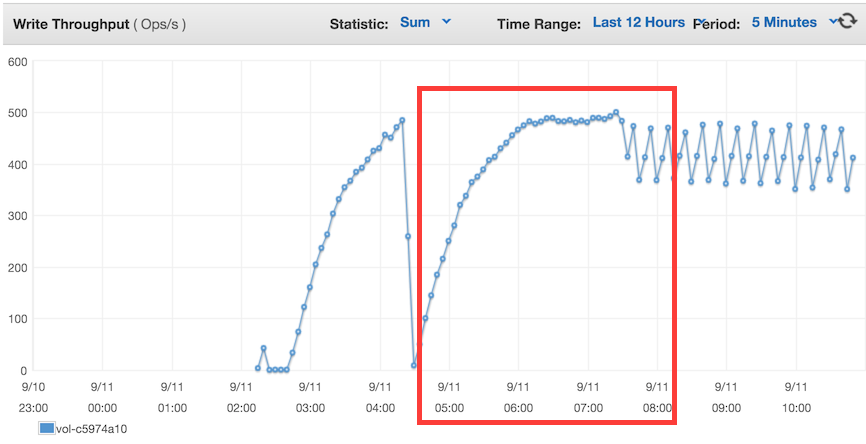
One item/graph to note is the Disk IOPS related to the extra volume (GP2 instance, SSD) that was used for Whisper storage. The IOPS graph above shows that the volume exceeded the 300 IOPS allocated and ventured into the burst zone for quite some time. Burst capability saved most of the test in terms of not filling up the Carbon Cache instances memory (i.e. throttling/IOWait) and the graph actually resulted in a nice metric related to what we need in terms of IOPS to support such a system running at capacity of ~1.2M metrics per minute. However, any increase in throughput into the metrics stack would undoubtedly result in a need for a different volume type - since the graph seemed to taper off at around ~500 IOPS, we could either increase the volume size such that the baseline IOPS was around 500 (at the time of this post, a 200GB GP2 has a baseline performance of around 600 IOPS), or choose a different volume type, such as a provisioned IOPS drive.
Conclusion
This test proved the theory that CPU binding can be resolved via multiple Carbon Cache instances on a single host behind a Carbon Relay. However, the Relay can become a bottleneck to the entire system, thus reducing the throughput of the metrics stack. Alternatives such as Carbon-C-Relay were built to address this but I have not yet had the time to test this relay type. Also, it’s worth noting that the performance on this instance with this configuration, even at 1.2M metrics/second, exceeds the standard GP2 type SSD IOPS limit and pushes the disk into the burstable range. Therefore, any further exploration related to tuning the Carbon Relay and/or swapping out the relay for a faster C-implementation would likely require exploration of a different disk type with a much more generous allowable standard IOPS limit (something like provisioned IOPS or throughput optimized).
In addition, there are failure scenarios to consider when running in this type of setup. For instance, if one of the two (or multiple) Carbon Cache instances goes down/fails, the Carbon Relay will simply start queuing ALL messages incoming (including those of the second/other Cache instances) until the problem Cache instance is back up and running. This can quickly fill up the instance memory and cause a catastrophic failure. Many various architectures have been designed to address this type of failure, but doing so involves creating more complexity in the overall architecture and supportability of the system which needs to be considered. Questions should be asked in terms of what level of failure is acceptable and whether an alternative storage mechanism (i.e. Kinesis, Kafka, etc) can serve as a viable alternative for such a failure - in other words, if something completely fails, it is acceptable to still pull the data from a data source for the last XX hours to backfill metrics presuming that you do not expect there to be failures consistenly, have sufficient automation in place to address failures, etc.