Pass 3 extending a previously implemented approach to tuning a Graphite instance on an Ubuntu 16.04 virtual machine. As seen in the last attempt, the Carbon Relay is a huge bottleneck to performance of the multi-Carbon Cache setup. This pass switches out the Carbon Relay for a more optimized C implementation of the Relay instance in an attempt to remove the bottleneck in throughput.
Background
Once the CPU bottleneck was identified in the single Carbon Cache implementation, the next step was to attempt adding a relay with multiple Carbon Cache backends in order to help the Python GIL issue dealing with lack of multiple CPU usage by a single process. However, when implementing a single Carbon Relay with multiple Carbon Cache back-ends using a consistent hashing algorithm for distribution of metrics, it became very clear very quickly that the Relay then became the bottleneck to performance (which makes sense given that the Relay code is essentially within the same code base as the Carbon Cache instance and, therefore, would likely exhibit the same performance characteristics - to a degree - as the Cache instance).
The next logical step was to look around for improvements related to the Relay instance. There were a couple different options. First, there are a limited number of tuning parameters associated with the relay that could be leveraged. However, after doing quite a bit of research, there appeared to be decent enough consensus by the community that the Relay instance bundled with the Carbon Cache Python code base was simply not performant enough to warrant spending time on for metrics throughput of any signficance. Instead, there are a couple alternatives to the Python version of the relay - specifically, the Go Implementation and the C implementation. Given that I have had really good luck with C-based applications/services in the past and there seemed to be fairly widespread adoption of the tool, I elected to try out the C-relay impementation first.
Setup
This test setup was fairly similar to the previous in terms of the service layout. However, for this test, I elected to house 3 Carbon Cache instances along with their Graphite Web counterpart on a single Amazon Web Services EC2 m3.xlarge instance. This instance type has 4x virtual CPUs at 2.5GHz, with 15GB of RAM. Setting it up on this instance means that there is essentially (obviously not exactly given the Kernel handles the CPU switching) 1 CPU per Cache instance plus 1 left over for the Graphite Web application. As before, however, Whisper was still installed on a 100GB volume having a performance baseline of 300 IOPS, burstable to 3000 IOPS with credits.
The relay, for this test, was moved off to its own separate AWS EC2 instance type. The relay was installed on a single t2.large instance, which has 2x virtual CPUs at 3.0GHz, burstable to 3.3GHz, and 8GB RAM. The relay has the ability to cache, but the idea is to tune the relay to act more as a proxy than a store and forward service, so emphasis is more on compute than it is on memory. Since the relay is written in C, having it utilize multiple vCPUs for each thread launched is very much feasible (and in fact a major benefit of the service). Therefore, having multiple vCPUs available means we will tune the application to have roughly the same number of workers as the number of vCPUs available on the instance (in this case, 2).
One thing to note - the t2.large instance was used for the C-relay in order to have a slight buffer in the area of memory. The relay was configured for consistent-hashing, meaning metrics are ‘tied’ to one and only one of the Cache instances that the relay forwards to. If this Cache instances happens to go down/is unreachable for any reason, the Relay starts to cache all metrics until the relay is again available, meaning some buffer time is required to be able to hold metrics in memory while the Cache instance issue is resolved and the Cache is brought back online. Failure to do so within the time it takes to fill up memory on the Relay results in a complete loss of metrics for that timeframe. This is an important point in this architecture and will certainly be explored further in terms of how much time can be afforded by various EC2 instance types containing different memory at various ingest rates.
Carbon Cache - Configuration
The Cache instances were configured on the m3.xlarge instance using the same method as this previous post. However, instead of having 2 Cache instances, 3 total were configured on the m3.xlarge instance (1 more than the original post shown), and the relay was never configured/started as part of the original Carbon stack. Therefore, the relative configuration looked like so:
[cache:a]
LINE_RECEIVER_PORT = 2103
PICKLE_RECEIVER_PORT = 2104
CACHE_QUERY_PORT = 7102

[cache:b]
LINE_RECEIVER_PORT = 2203
PICKLE_RECEIVER_PORT = 2204
CACHE_QUERY_PORT = 7202

[cache:c]
LINE_RECEIVER_PORT = 2303
PICKLE_RECEIVER_PORT = 2304
CACHE_QUERY_PORT = 7302
In addition, the Graphite Web configuration needed to be adjusted slightly to include the third Cache instance as well:
CARBONLINK_HOSTS = ["127.0.0.1:7102:a", "127.0.0.1:7202:b", "127.0.0.1:7302:c"]Obviously when running the start commands in the previous post to start the Cache instances, ensure
you add a third start command and specify --instance=c to start the third Cache instance.
Carbon C Relay - Installation and Configuration
To install the Carbon C Relay, use the native package management system:
$ sudo apt-get install carbon-c-relayOnce the relay binary is installed, create a configuration file somewhere on the system to be used by the relay itself. The configuration file should have the following content:
$ vim relay-config
# ensure the file contains the following, replacing the <IP> with the IP of the EC2 instance hosting the caches
# it's worth noting that there is another consistent hashing algorithm that can be used - fnv1a_ch - that is
# considered faster given the reduced complexity of the hashing algorithm, but for these purposes, we expect
# to run into performance issues with Carbon before we do with the relay, so we will use the out of box/normal
# mode for consistent hashing - carbon_ch
#
#   cluster graphite
#        carbon_ch
#                <IP>:2103=a
#                <IP>:2203=b
#                <IP>:2303=c
#        ;
#
#   match *
#        send to graphite
#        ;
As stated earlier, using the Carbon C Relay allows us to tune the number of threads/workers to utilize multiple vCPUs. On the t2.large instance, there are 2 vCPUs and, therfore, we will start 2 worker threads for the Relay:
# start the relay using the 'relay-config' with 2 worker threads in the foreground
# you can also start the relay in debug '-d' mode, which would print the statistics to STDOUT as well as Carbon
$ carbon-c-relay -w 2 -f relay-config
Results
As expected, performance improved DRASTICALLY yet again. In fact, so much so that the load test script sending metrics to the C relay needed to be throttled because it sent metrics so fast and the Relay handled them so quickly (on the order of 10M metrics/minute+) that it almost immediately caused the Cache instances to fall over. Once the load test script was tuned, some more promising numbers showed up…
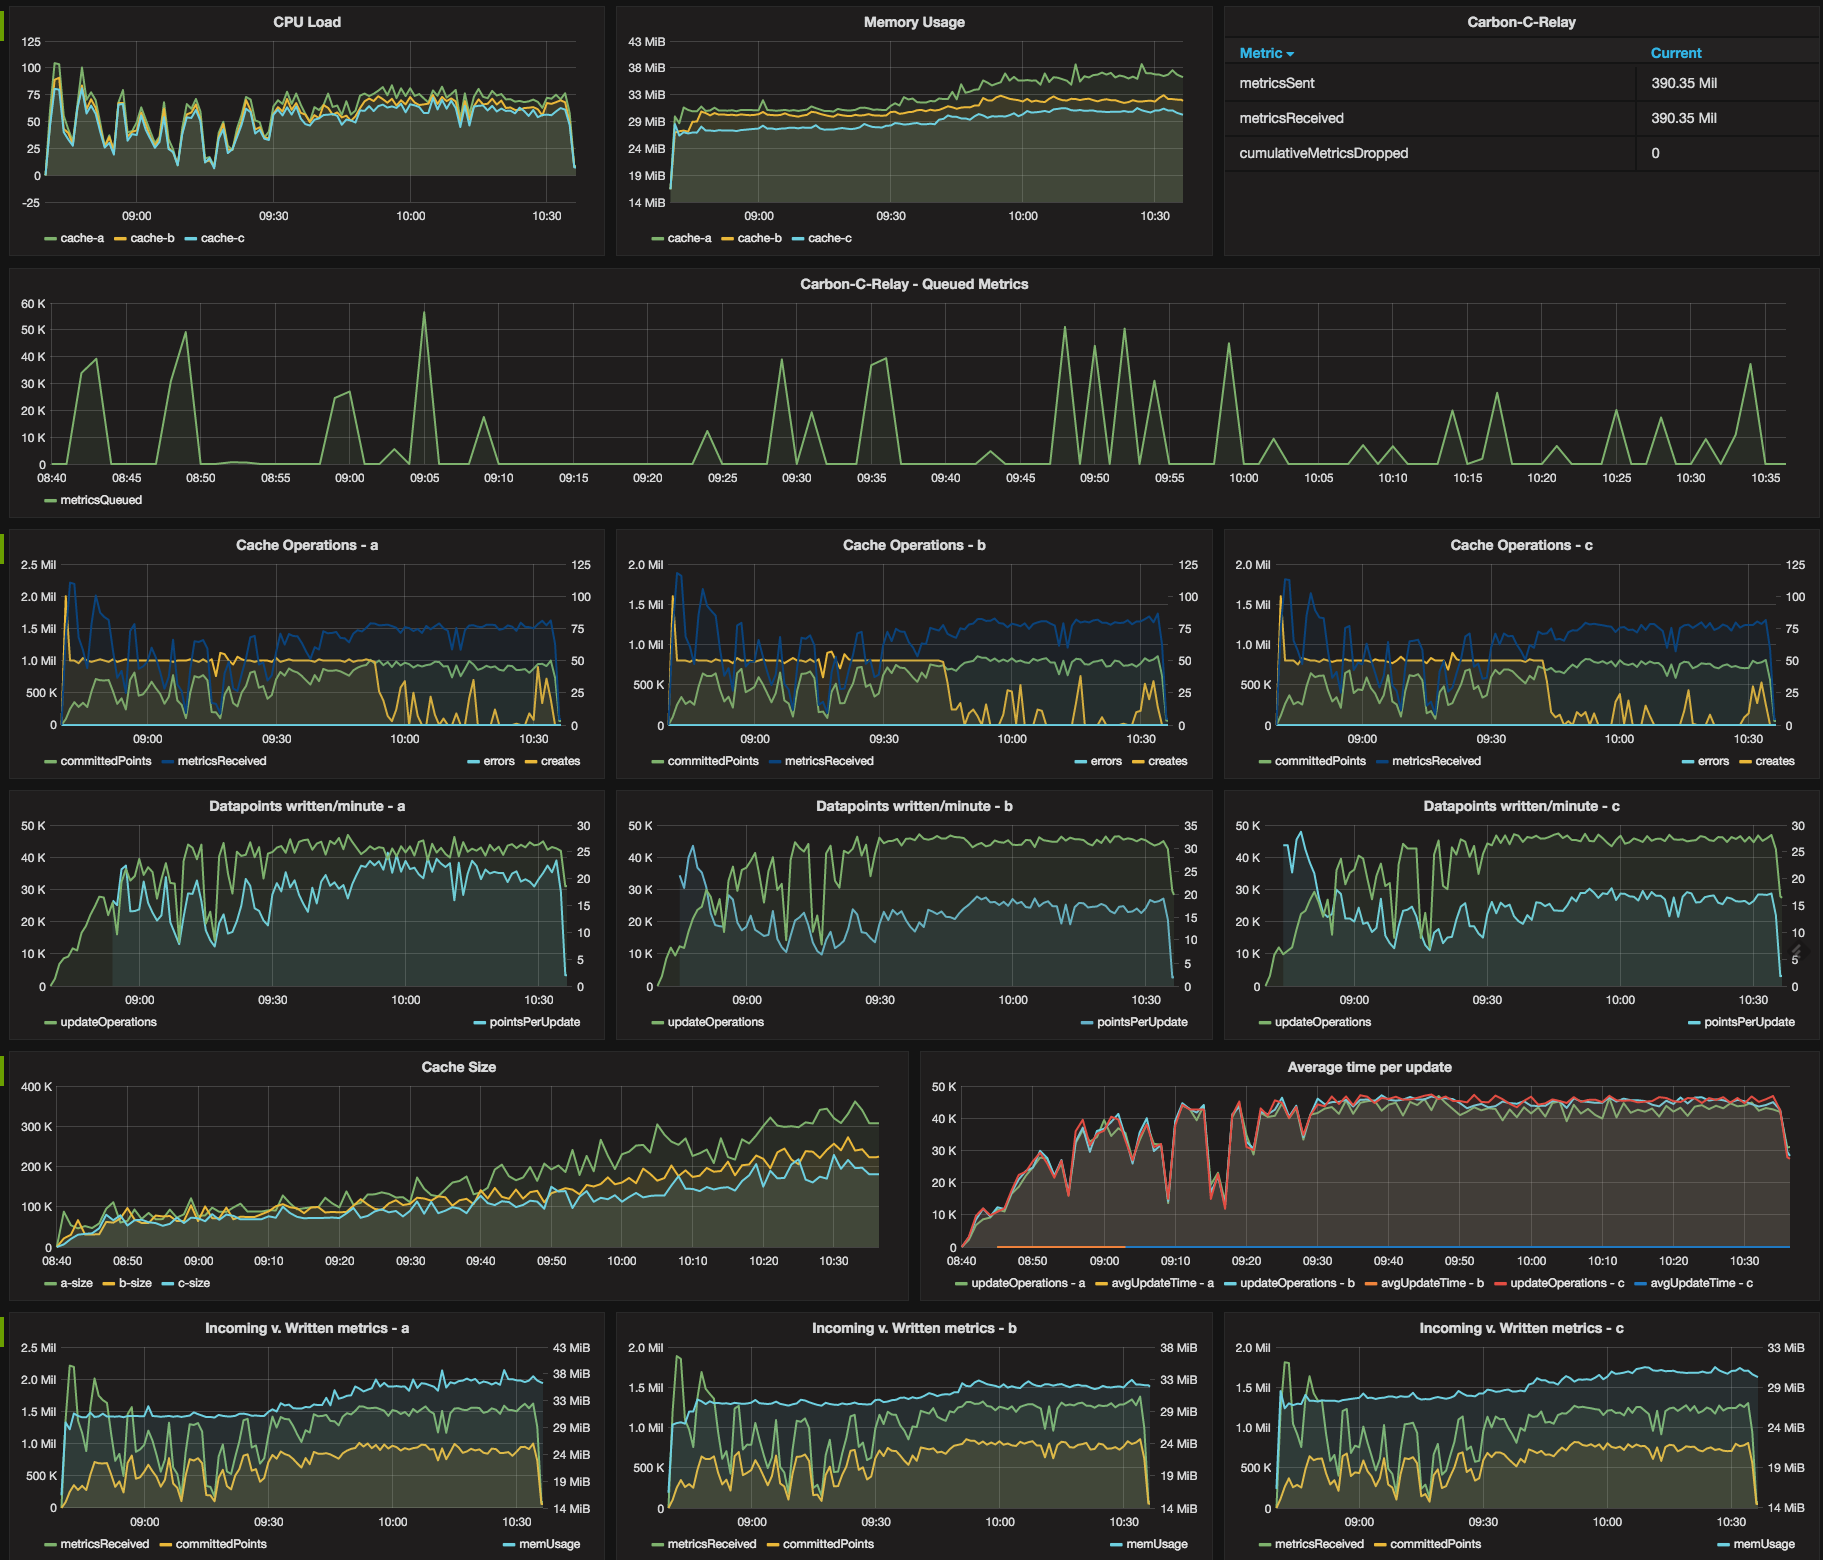
The overall dashboard above was yet again adjusted slightly as we learn more about the metrics and operation of the Graphite stack. It shows, however, some really promising numbers that we can explain/explore a bit more in detail.
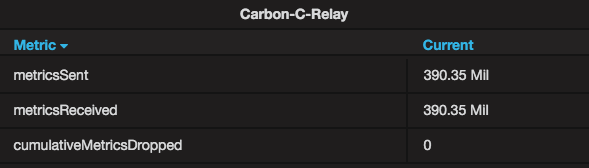
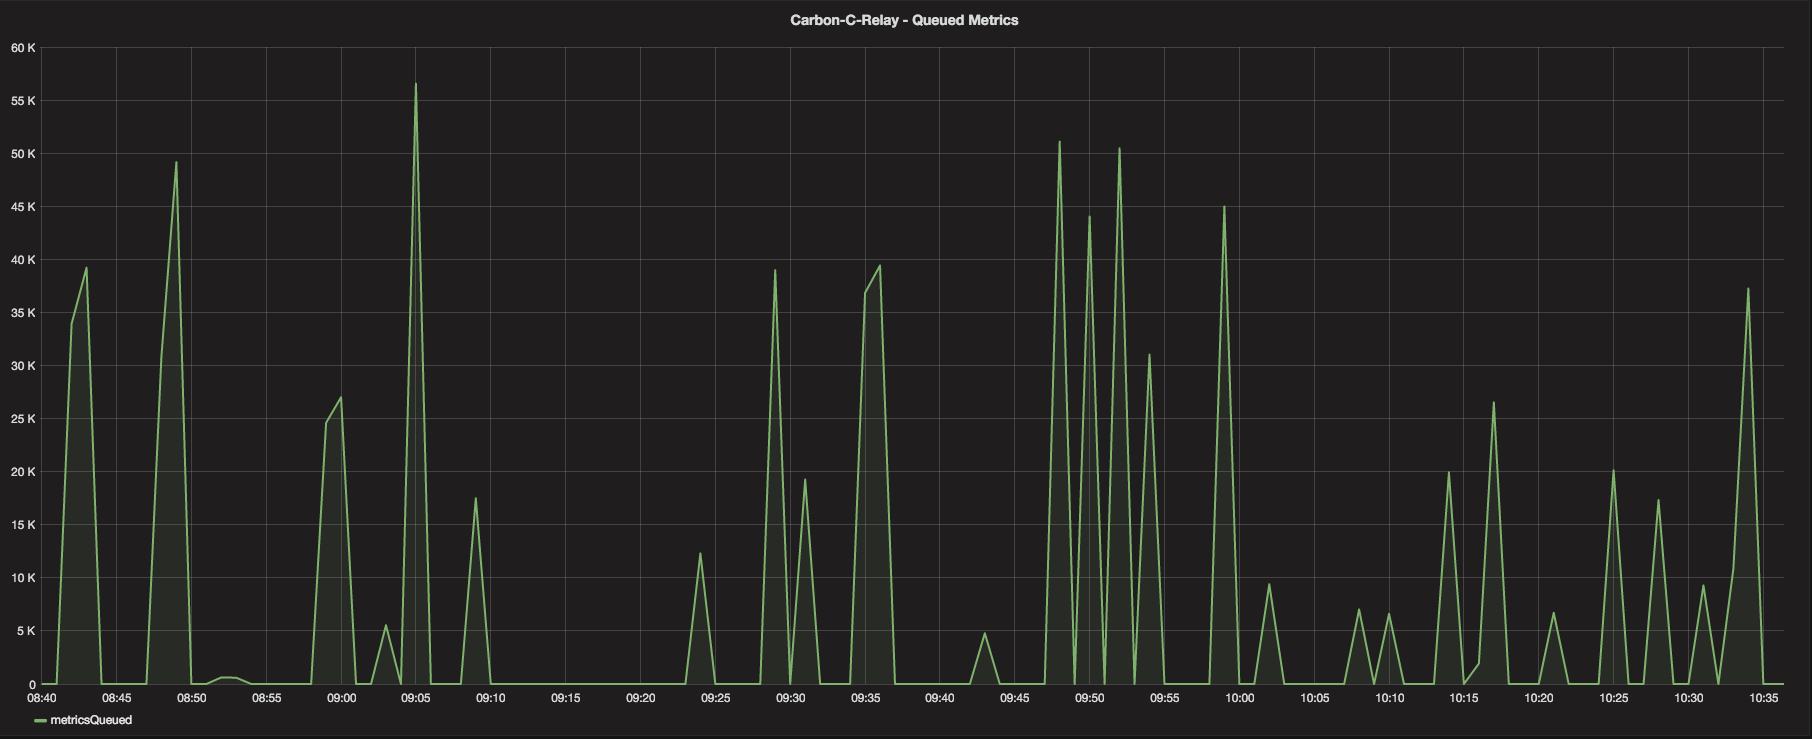
One of the changes to the overall dashboard was the inclusion of Relay metrics - in this case, specifically, the C Relay metrics. As see, the Relay handled approximately 390 Million metrics in a little less than 2 hours with no drops of metrics at all. The Queue graph shows that the relay did in fact have to queue some metrics (buffer) while it waited on the Cache instances to become available/free up for processing, but the queue almost always drained quickly, keeping the memory footprint of the Relay fairly low and the throughput very high. The max queue size of the C relay was never reached and, therefore, no metrics were dropped at the Relay.
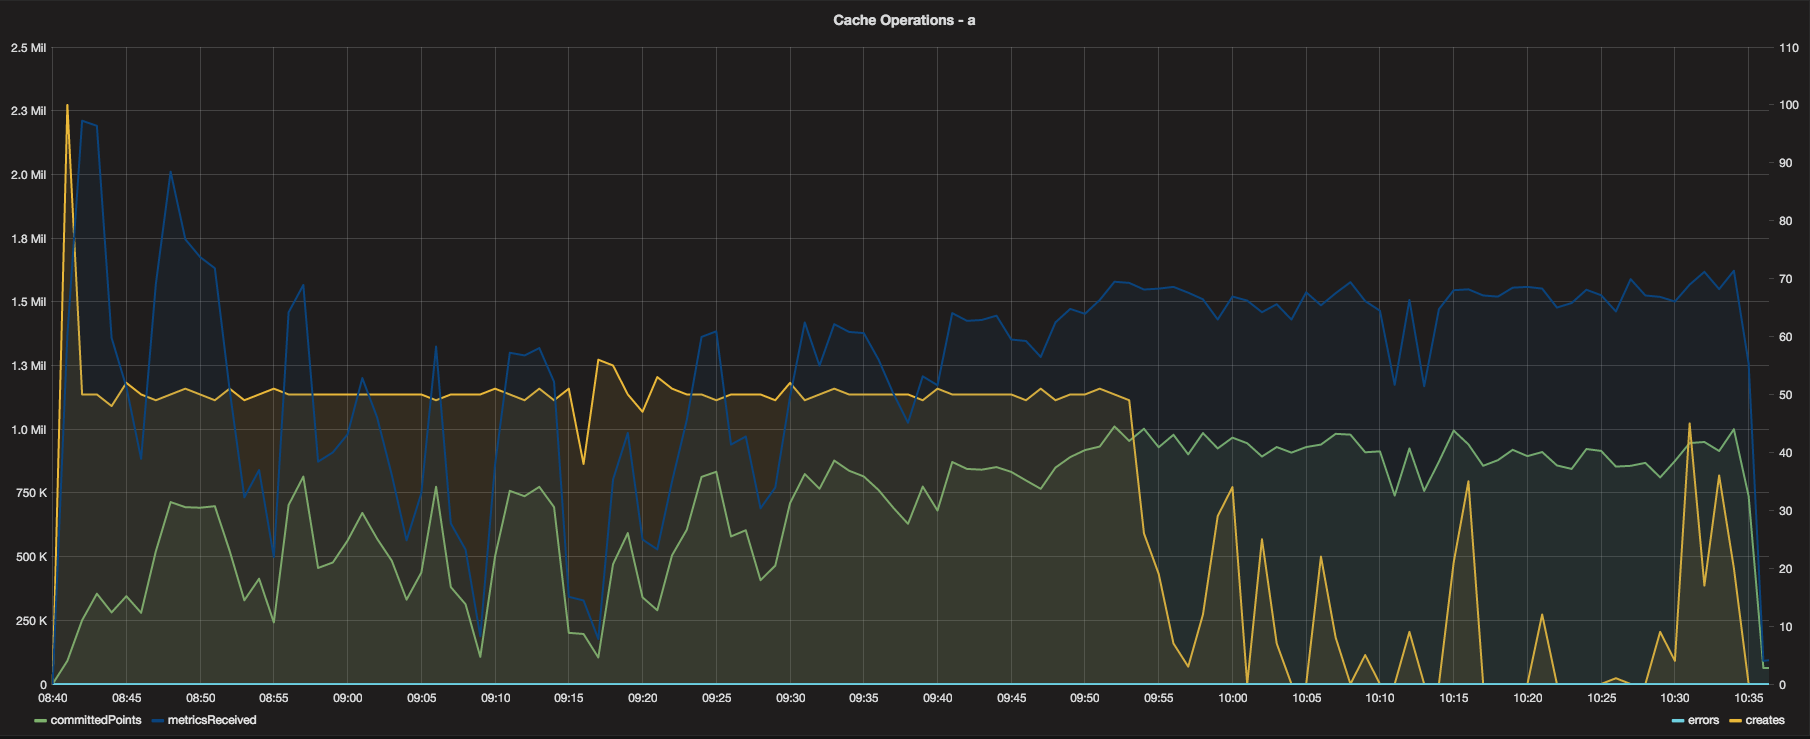
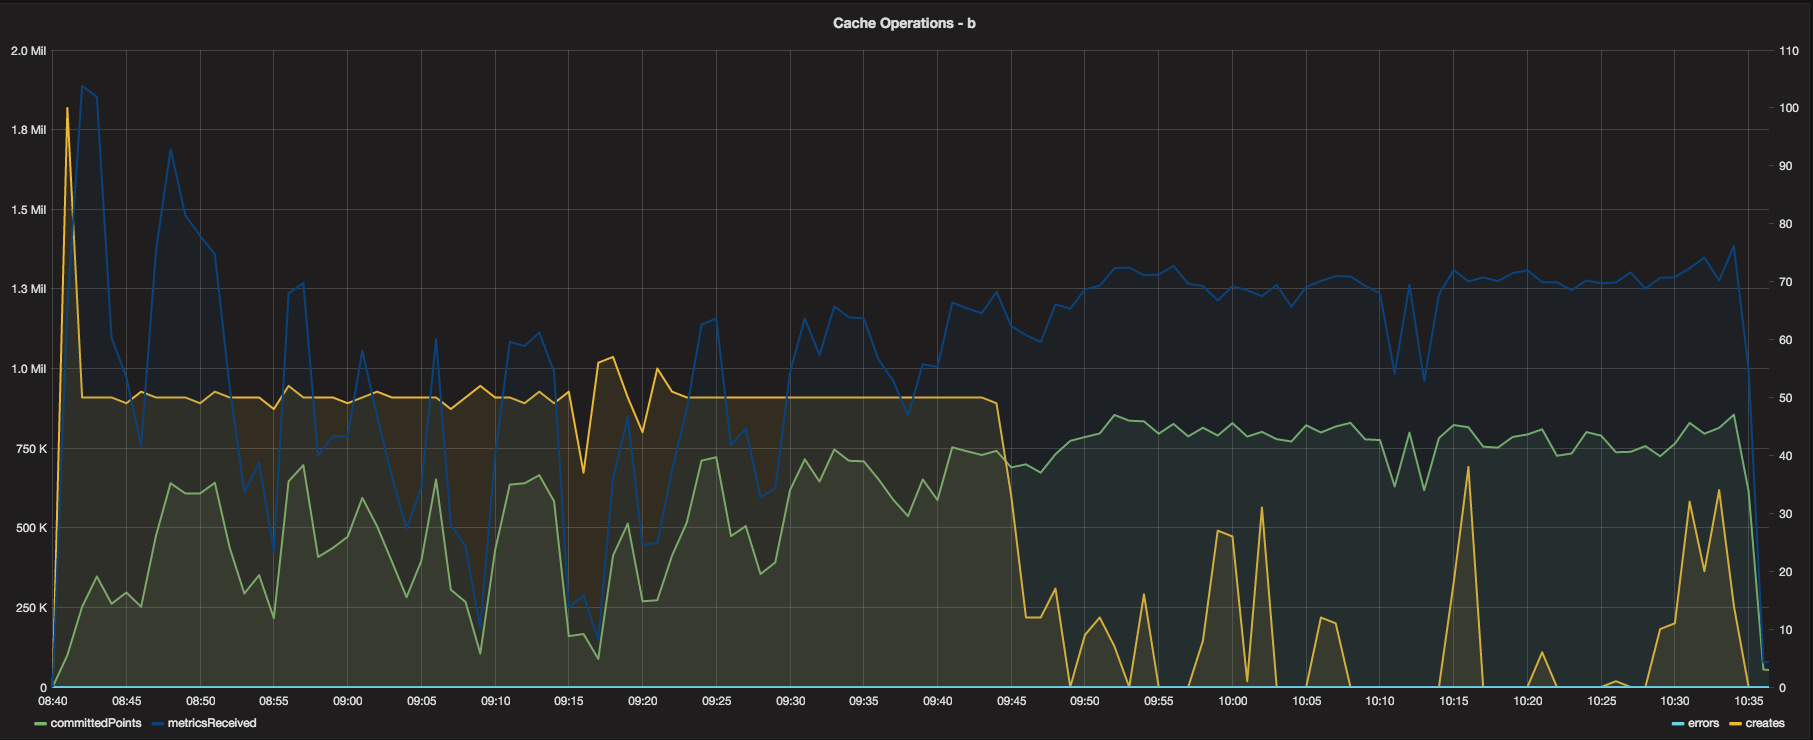
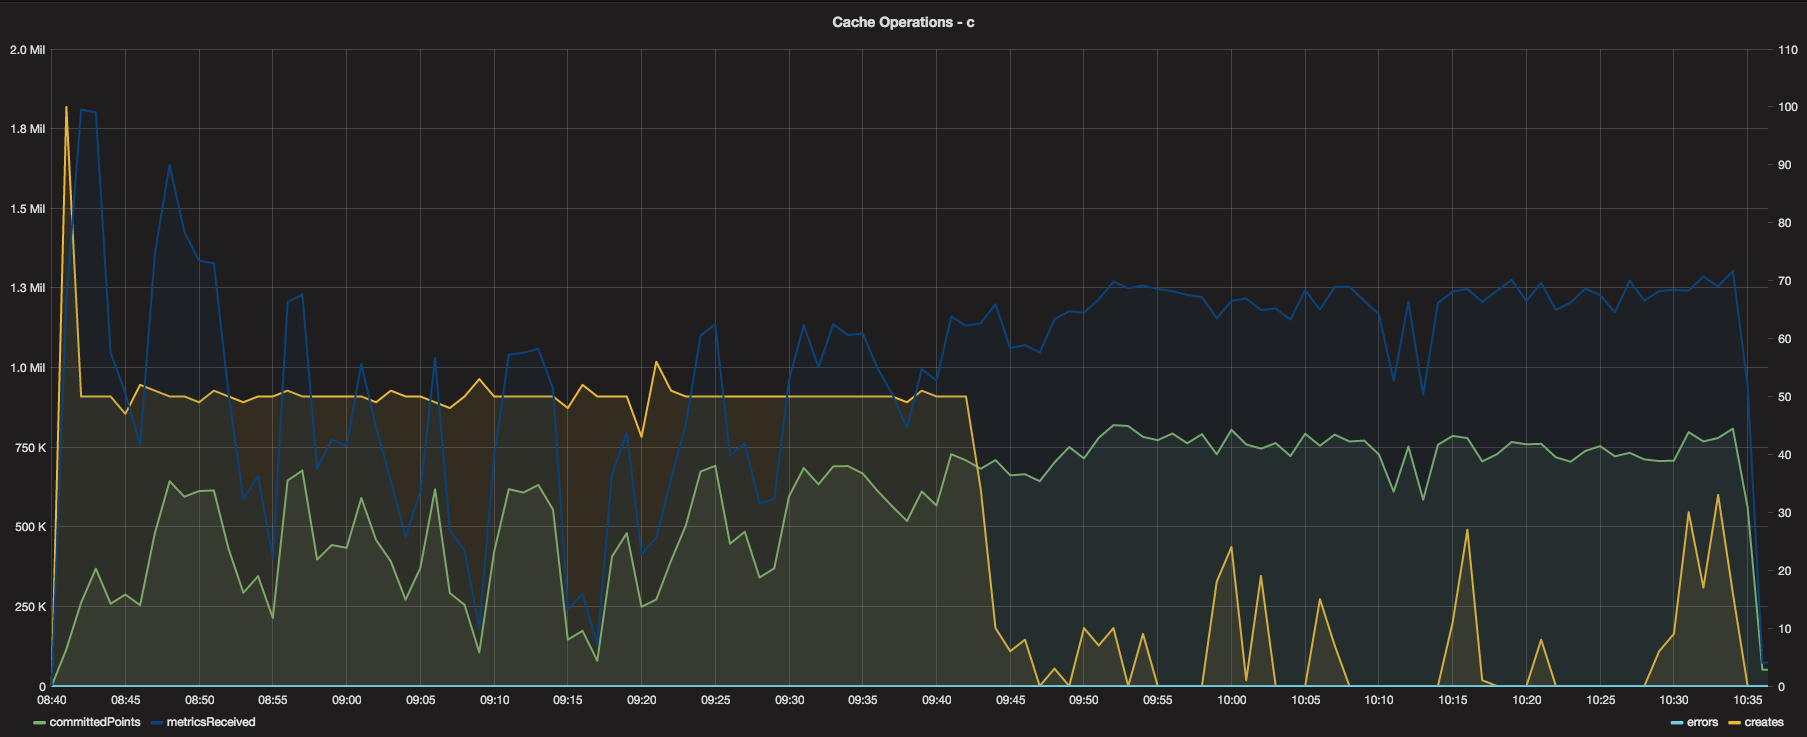
Looking at the Cache now, the Cache operations graphs are consistent and show fairly even distribution of
incoming metrics from the relay. The metricsReceived for each Cache instance was between 1-1.5 Million
per minute, with a total of around 3.5 Million per minute across all three Cache instances - not too shabby!
There were no errors during the test (no lost metrics) and the front of the test was utilizing the maximum
creates per minute (50) until it received all new metrics, at which point the remainder of the test was
mostly update operations.

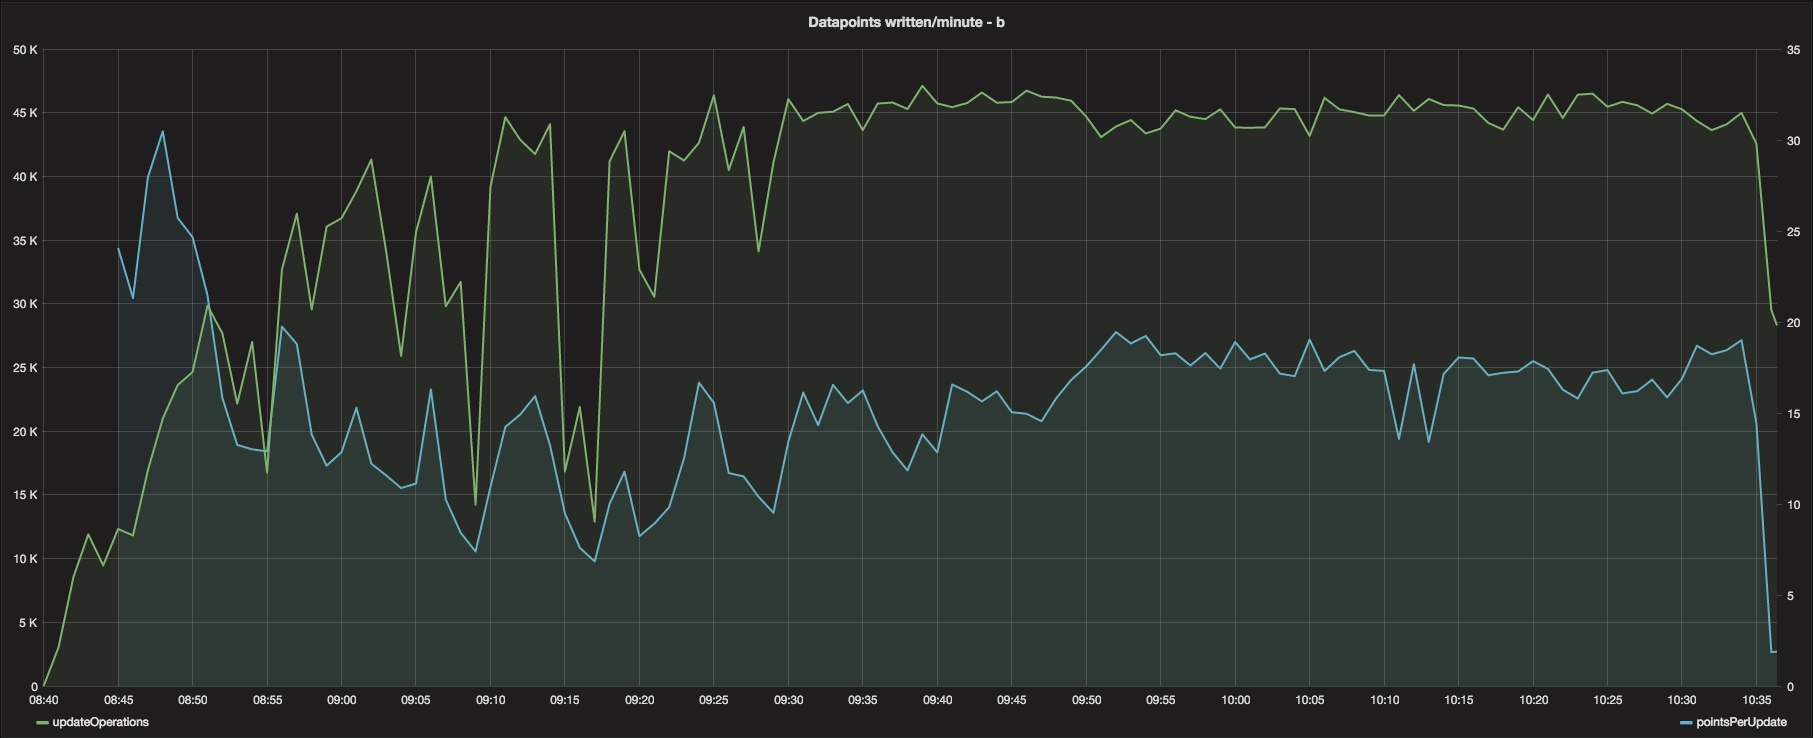

The updateOperations and pointsPerUpdate graphs were fairly consisten across all 3 Cache instances and
there is not too much to speak about related to these graphs.
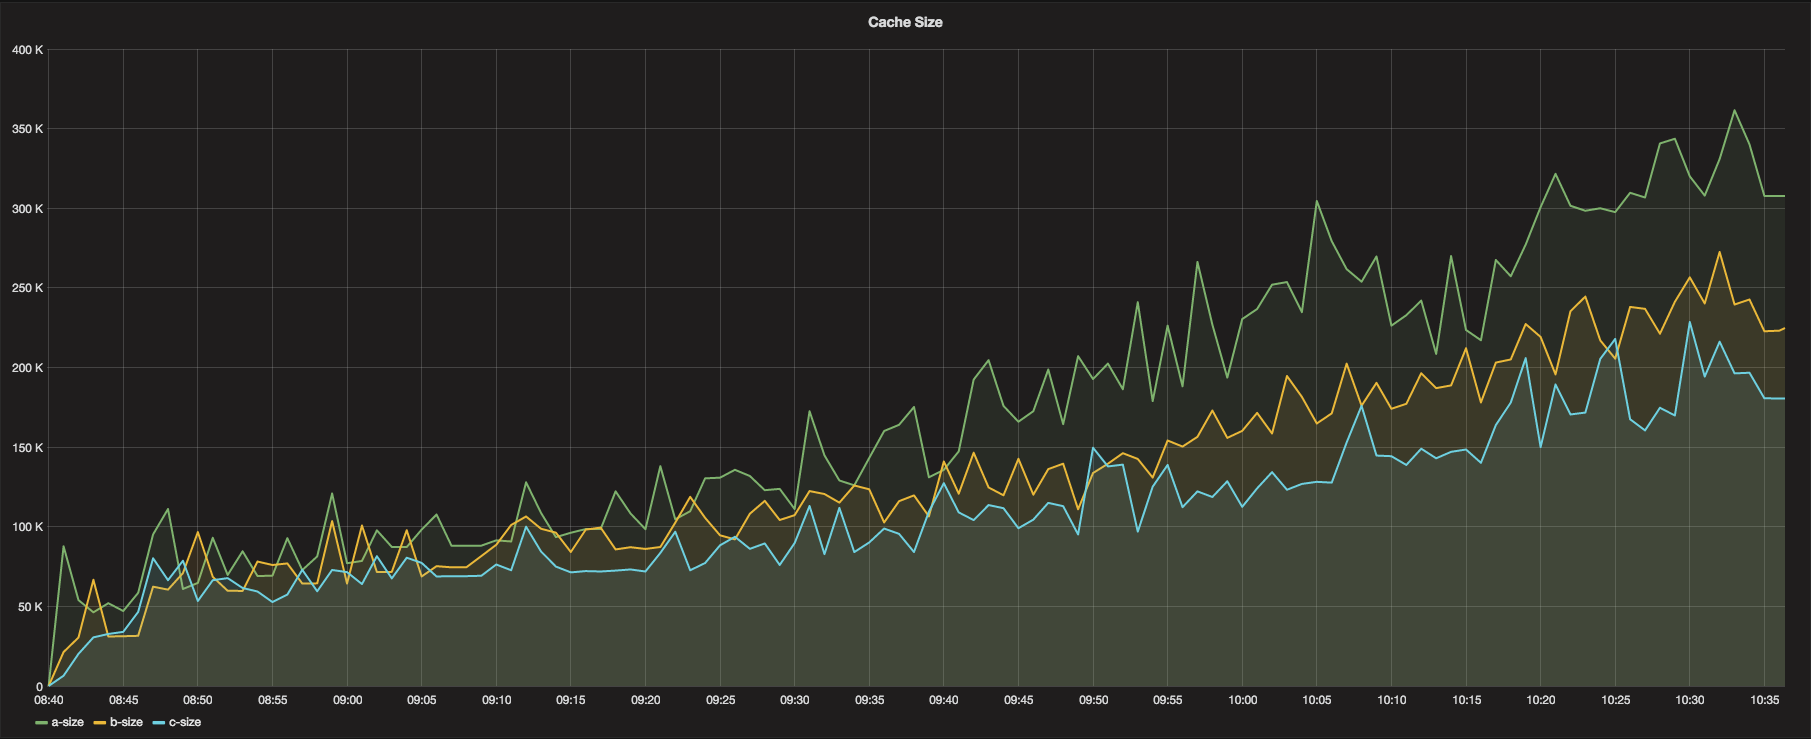
The cache size graph proved to be quite interesting, and this graph warrants some more exploration and longer trials with this configuration. Cache sizes for each Cache instance grew up to about between 200k and 300k in size. This is not terrible in itself, but the more concerning point is the apparent lack of crest in the growth rate. Without further investigation via a larger data set for a longer run, this means there is a potental for the Cache instances to consume all the available memory on the host instance (after a very long time, given the memory graphs) causing the Graphite stack to fail. In addition, and more likely, the CPU utilization would climb to the point of causing the machine to starve CPU cycles due to the sorted writes that occur to the Whisper file system. The larger the queue size, the longer it takes to sort the queues, and the more processing power required.
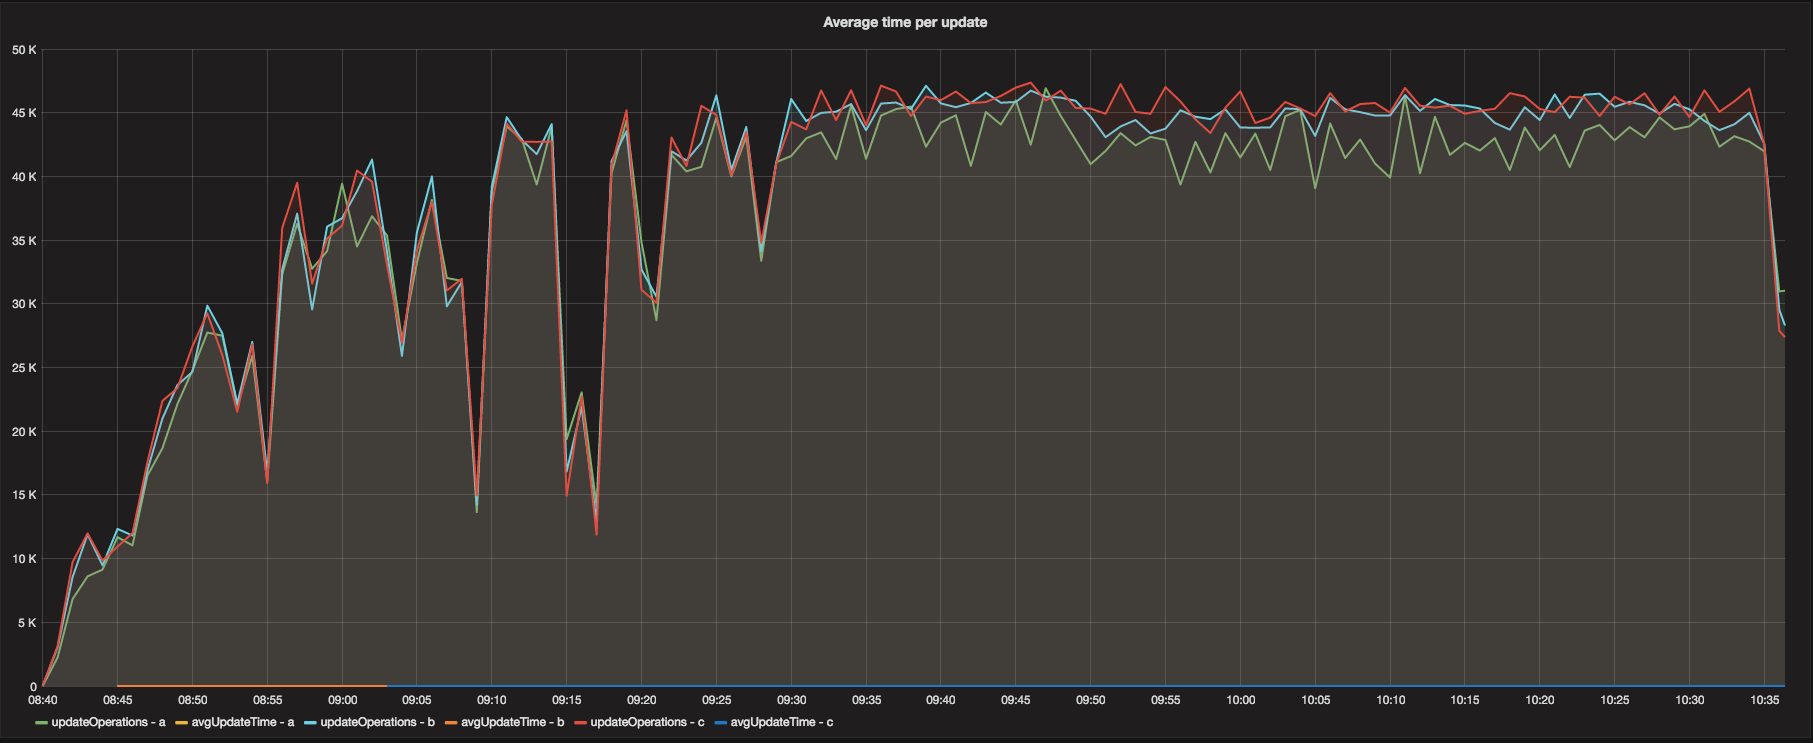
The updateOperations in the graph above were consistent enough to avoid conversation about.
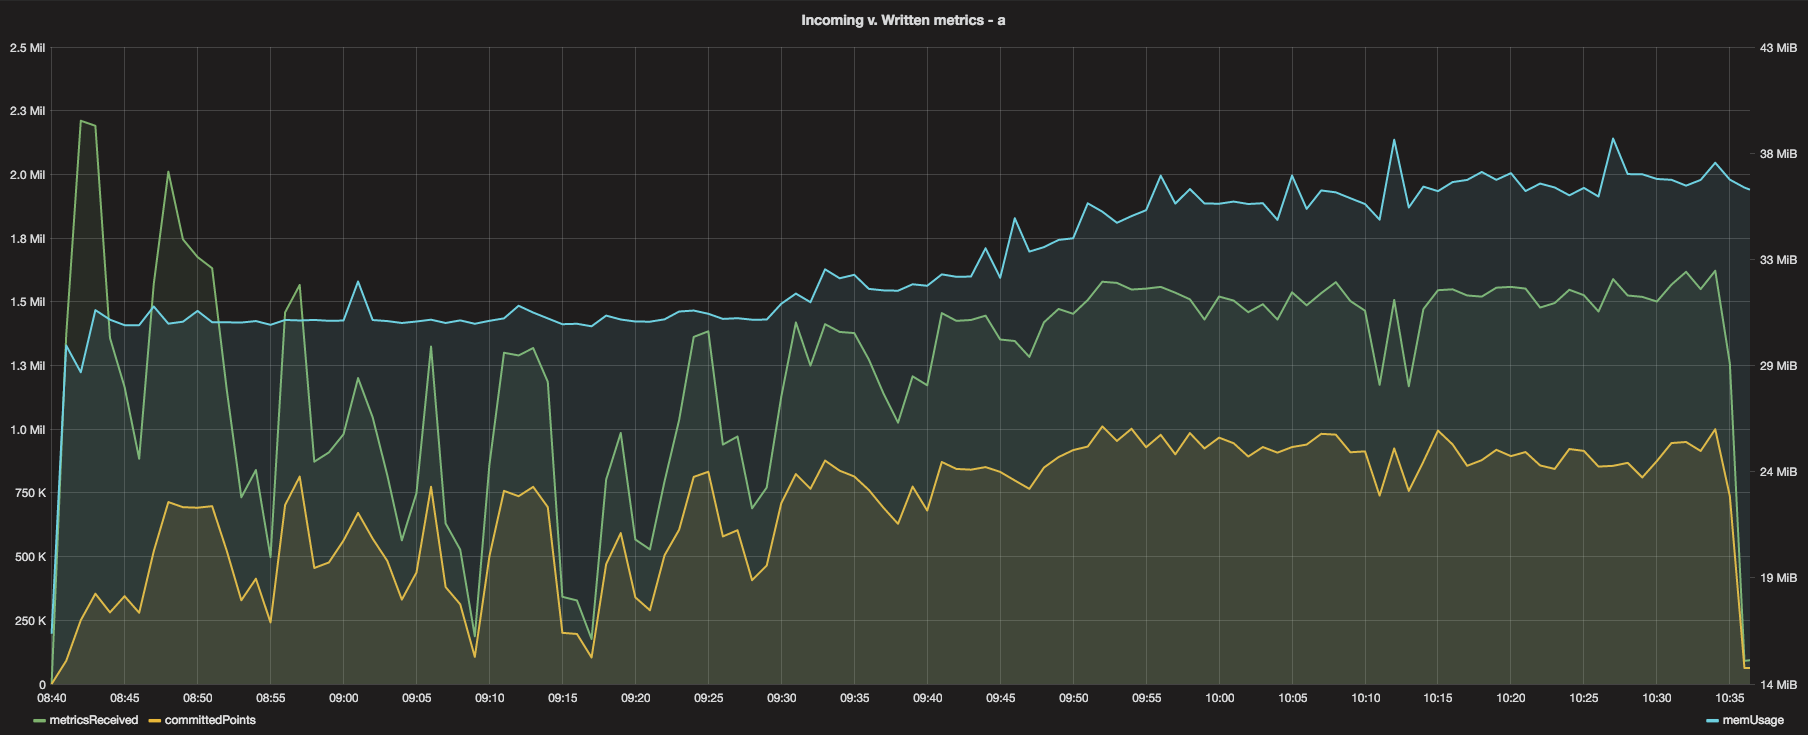
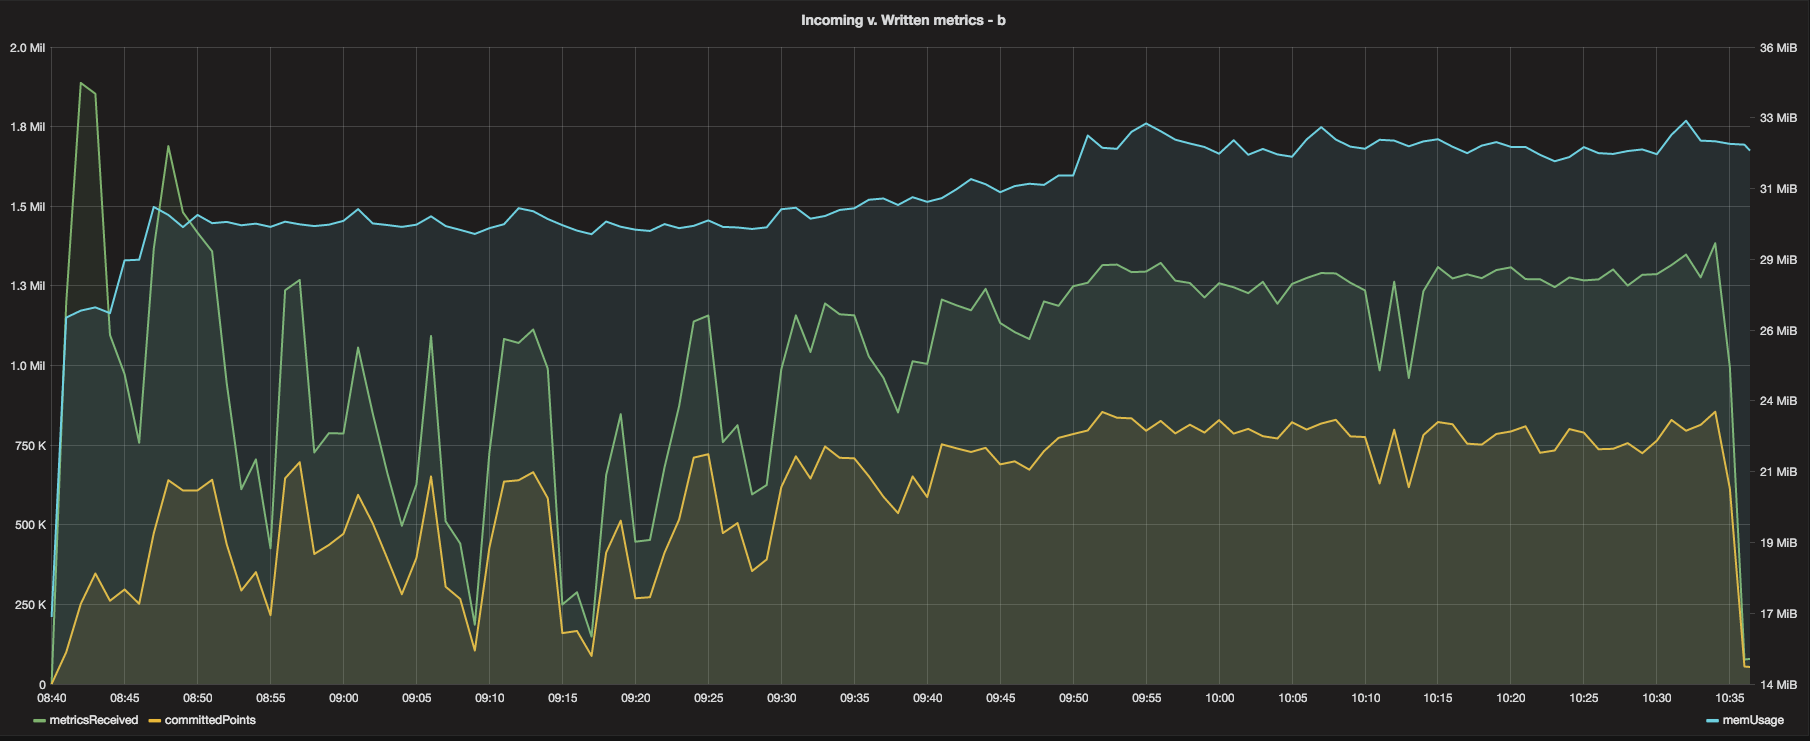

Incoming vs. written metrics was also a promising graph. Showing that the written metrics lagged behind incoming by around 500k would prove concerning - however, if you inspect the graphs, you’ll see that the apparent 500k deficit was almost perfectly ‘locked in’, meaning that after the 500k deficit was reached, the system pretty much kept up at a consistent pace.

Disk IOPS in this test were again a bit high as compared to the very first tests related to single Cache instances. This is to be expected given that the throughput of this overall system is much higher, and there are now multiple Carbon Cache instances writing to disk at the same time. The burstable nature of the GP2 volume makes this a non-issue, and again (as previously stated) there are other storage alternatives to address the 300 IOPS baseline of the 100GB GP2 volume (including simply increasing the size of the drive such that the baseline IOPS increases natively).
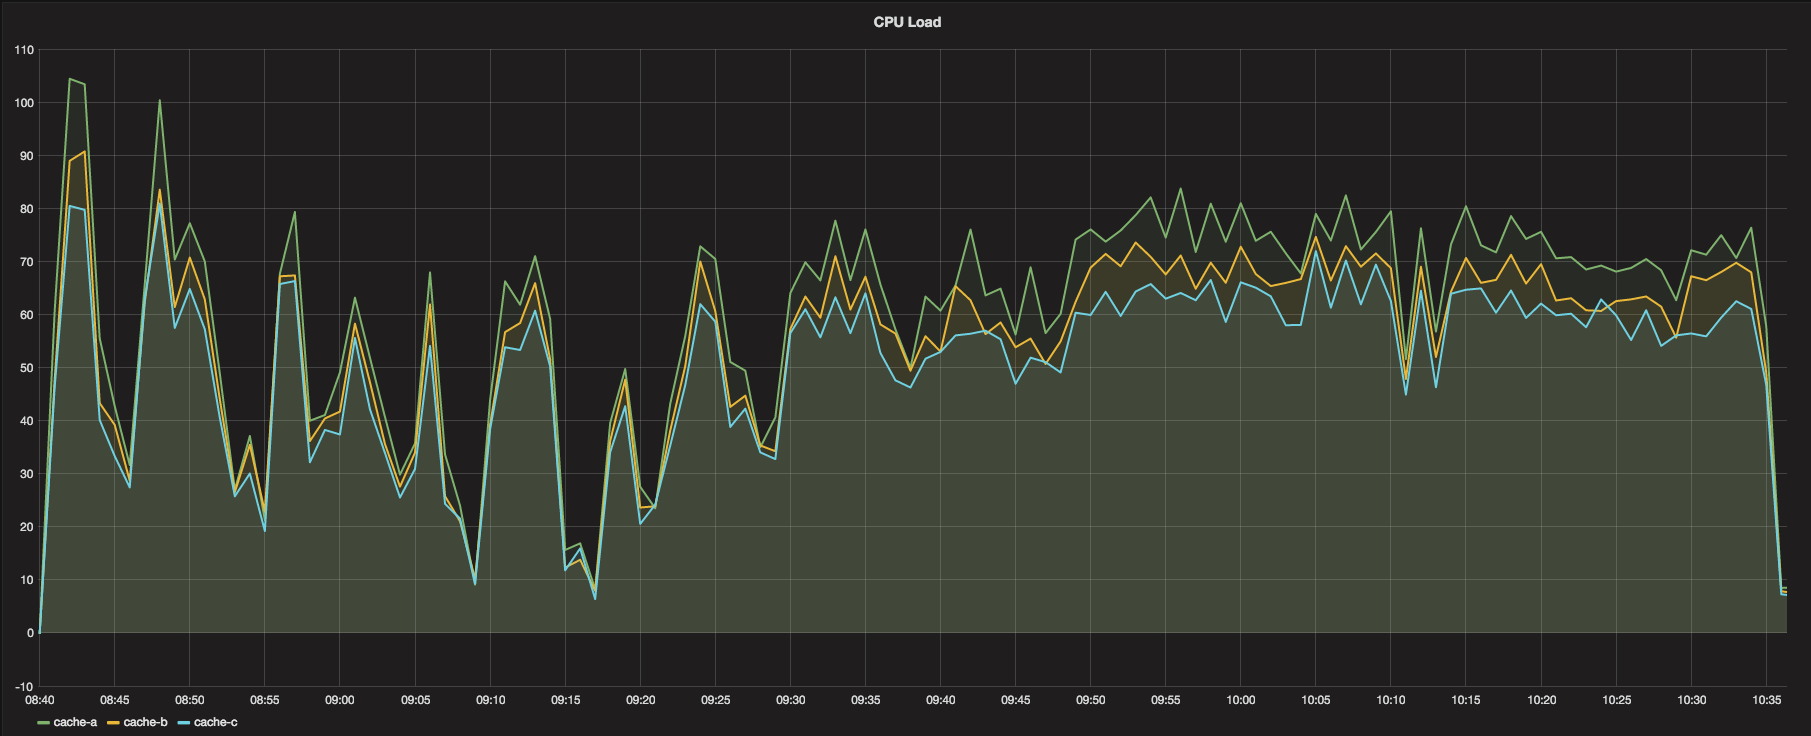

Last, but certainly not least, are the CPU and Memory graphs. CPU load was extremely reasonable for this test as compared to our last test, meaning we have almost certainly addressed the CPU bottleneck issues. Memory consumption, in addition, is negligible, the point that even the instance type may be considered overkill for the specs of the system (might consider a more CPU-based load host, such as a t2 general instance). Both of these graphs are very promising and prove positive for the test.
Conclusion
This test was run at a somewhat sustained ~3.5 Million Metrics/Minute. The test proved to be extremely positive in the sense that it proves the Graphite stack can perform at much higher levels than most people have previously advertised with the correct understanding and tuning of the system, in addition to a separate Relay component written in C to address the performance bottlenecks associated with the original Graphite Python Relay.
In addition, there are several physical tradeoffs that need to be considered in terms of hardware utilized for the architecture moving forward. For instance, the Carbon C Relay performs so well it could likely be moved to a smaller/less powerful (and cheaper) EC2 instance type and perform quite well (better than needed). In addition, the multi-cache dedicated m3.xlarge instance could likely be reduced as well given that the memory consumption was extremely negligible. The catch is to ensure that there are enough processors available to run the multiple Cache instances.
Lastly, a bit more testing is required prior to jumping to any conclusions about this 3.5 Million Metrics per Minute setup. As can be seen in the Cache Size graph in the results, there is an ever so slight upwards trend in the cache size. Although the size appears to level off towards the end of the test, it still exhibits a gradual incline and there is no enough data to make a determination as to where the size graph would go next. In order to ensure integrity of the system and ensure it can keep up longer term, a larger data set (longer running test) would be required to allow extrapolation of the cache size.